Range Multi Alligators
- Indicadores
-
Wartono
 No body knows. No Big Boy. BUY-SELL is only the wave. Everything will be back to nature.
 - Versión: 1.0
- Activaciones: 5
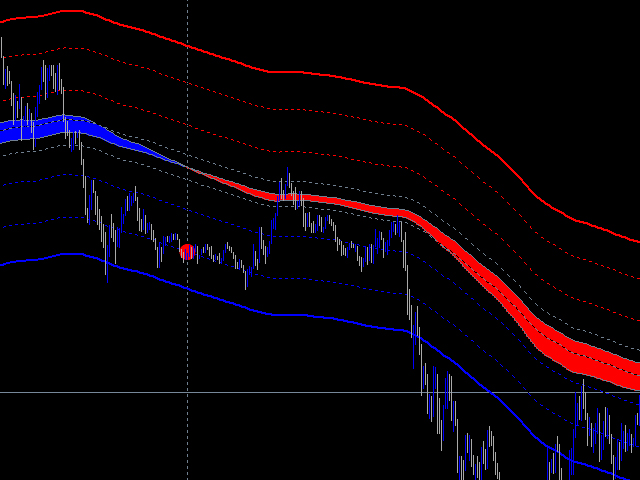
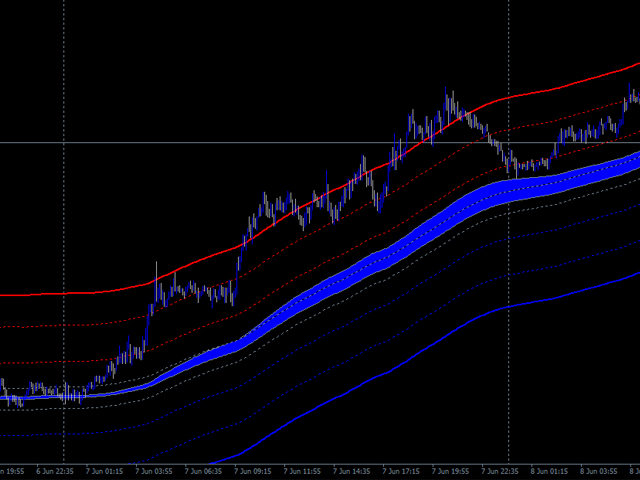
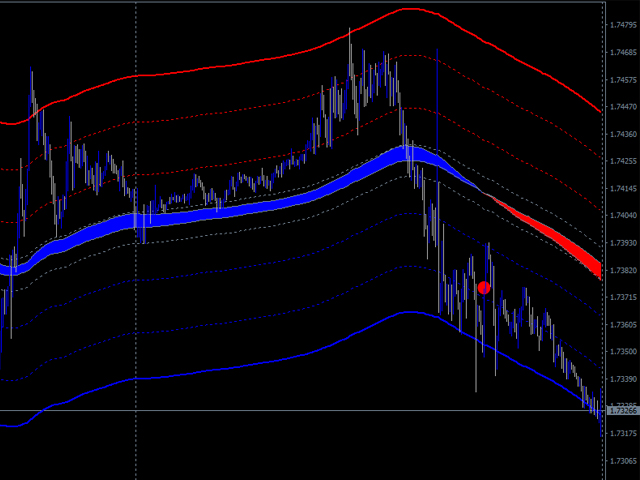
Range Multi Alligators proporciona la información de Range Channel High Low y la tendencia del mercado indicada por el histograma azul-rojo en el centro del range channel.
Las líneas del canal de rango son útiles para definir stoploss y take profit. Este es un indicador seguidor de tendencia basado en Multi Alligators. Colóquelo en el gráfico y cambie uno o todos los ajustes, entonces todas las líneas se moverán sincronizadamente con la actual.
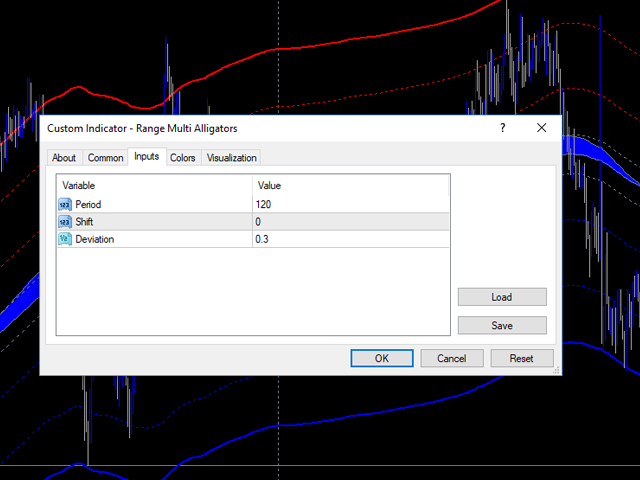
Parámetros
- Periodo: el número de barras utilizadas para los cálculos del indicador. Por defecto: 120 utilizado para TF M5
- Desplazamiento: El número de barras utilizadas para que el indicador se desplace hacia atrás ( el valor=negativo) o hacia adelante (el valor=positivo)
- Desviación: El rango de distancia entre las líneas superiores e inferiores,valor 0.1 a 100

Good one