Strong Oscillator
- Indicadores
- Versión: 1.0
- Activaciones: 10

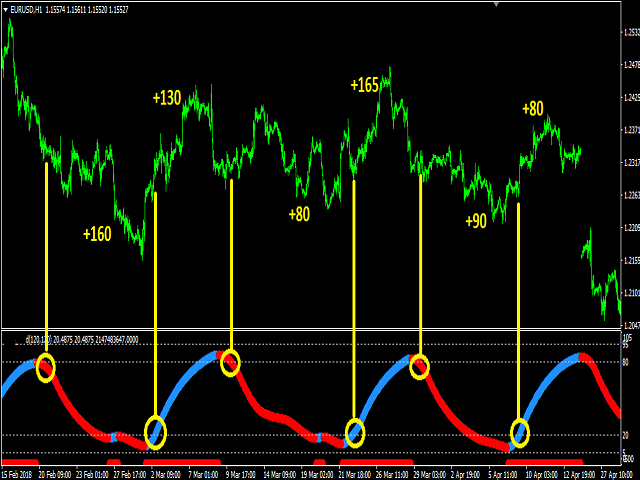
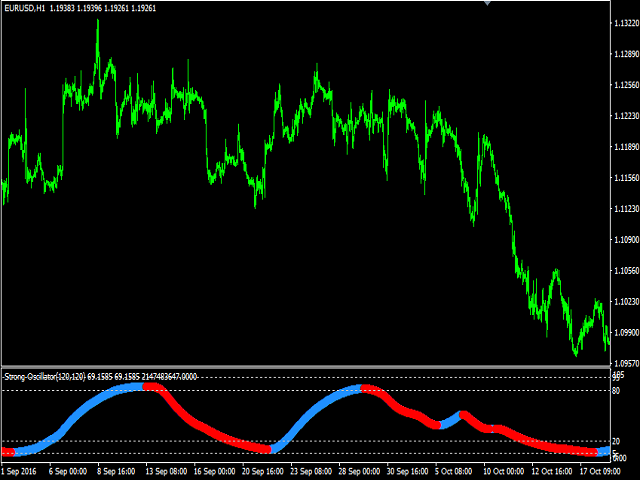
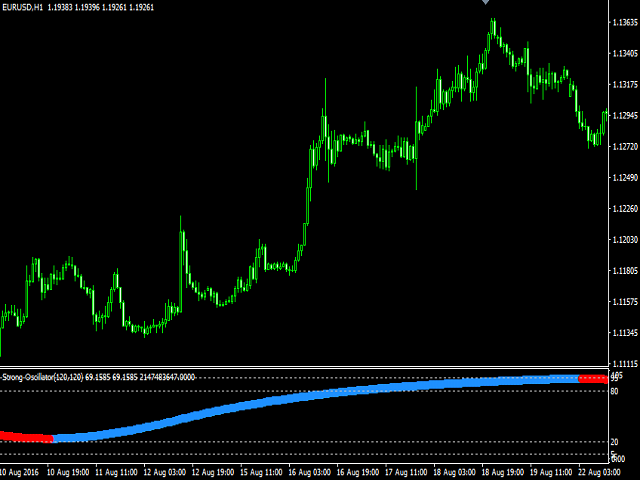
Strong Oscillator es un indicador diseñado para encontrar tendencias de indicadores. Encuentra tendencias utilizando un conjunto de algoritmos y un conjunto de indicadores.
Este indicador es un indicador de tendencia. Ayuda a encontrar tendencias fácilmente. Puede utilizar este indicador solo, o puede utilizarlo como indicador auxiliar de otros indicadores estratégicamente apropiados. Puede utilizarlo como indicador de validación de tendencias.
Sugerencias y características
- Hay 4 líneas de nivel en el indicador.
- Estas líneas de nivel 5, 20 y 80 son líneas 95.
- Las líneas de nivel 5, 20 se utilizan para encontrar la tendencia alcista.
- Las líneas de nivel 80, 95 se utilizan para encontrar la tendencia bajista.
Parámetros
- Period1 - Ajuste del primer periodo.
- Period2 - Segundo periodo.