EMA Trend
- Indicadores
- Versión: 1.0
- Activaciones: 20

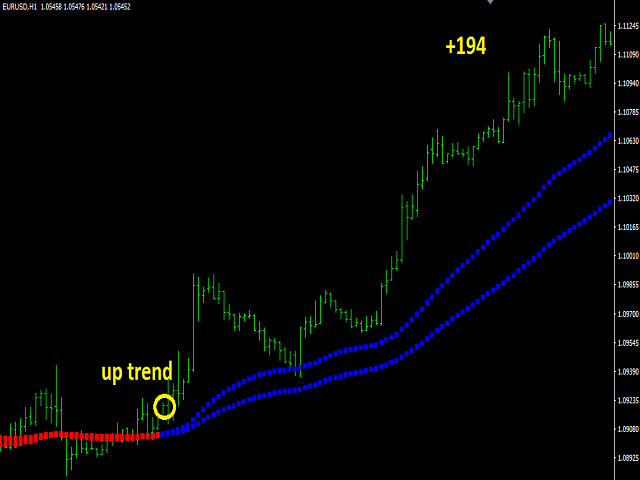
El indicador de tendencia EMA es un indicador de tendencia que utiliza dos medias móviles. Estas dos medias móviles son el principal indicador de tendencia con 89 EMA. 89 EMA se considera generalmente una tendencia en el mercado Forex. La segunda media móvil es 49 EMA. Se ha creado una tendencia utilizando dos medias móviles.
Puede utilizar este indicador solo como indicador de tendencia. O con otros indicadores adecuados para su estrategia. Este indicador envía un aviso cada vez que se inicia una nueva tendencia.
Características
- Puede seleccionar y editar los periodos.
- Marcos de tiempo, modo ma, modo precio.
- Puede recibir alertas de nuevas tendencias con funciones de alerta.
- Envía alerta a la pantalla de mt4
- Enviar alerta a la aplicación móvil
- Dirección de correo.
Parámetros
- Period_1 - configuración del nivel del periodo 1
- Period1_timeframes - configuración del periodo 1
- Period1_mode - configuración del modo del periodo 1
- Period1_pricemode - configuración del modo de precio
- Period_2 - ajuste del nivel del periodo 2
- Period2_timeframes - período 2 marco de tiempo de ajuste
- Period2_mode - configuración del modo period2
- Period2_pricemode - configuración del modo de precio
- AlertsOn - enviar alertas. Si esta función está activada, se activará en otras propiedades de alerta.
- AlertsMessage - enviar un mensaje
- AlertsSound - configuración de alertas sonoras
- AlertsEmail - configuración de alertas por correo electrónico. Envía alertas a la dirección de correo.
- SoundFile - sonido de alerta