Z Score Standardized Normal Distribution
- Indicadores
-
Florian Nuebling
 indicators based on statistical methods, probabilities and volatility. As price follows a random walk and assumed to follow a log-normal distributed, the provided concepts are based on log returns for normalization. Returns are mean reverting and can be approximated as normal distributed. The
 - Versión: 1.0
- Activaciones: 5
Este indicador de puntuación z muestra la puntuación z correcta de un activo, ya que utiliza los datos de precios normalizados para el cálculo, que es la única forma correcta. La puntuación Z sólo es aplicable a datos de distribución normal, por lo que no se tiene en cuenta el precio real, sino los rendimientos normalizados, que se supone que siguen una distribución normal.
Los rendimientos tienen una reversión a la media y se supone que siguen una distribución normal, por lo que el cálculo de la puntuación z de los rendimientos es más fiable que la puntuación z del precio, ya que el precio NO tiene una reversión a la media y no sigue una distribución normal, sino una distribución logarítmica normal.
La puntuación Z mide la distancia a la media en términos de desviación estándar. Si la puntuación z es 0, equivale a la puntuación media; si es 1,0, la distancia es de 1 desviación típica con respecto a la media. Por lo tanto, es importante que los datos subyacentes sigan una distribución normal, que es lo que se supone para los rendimientos.
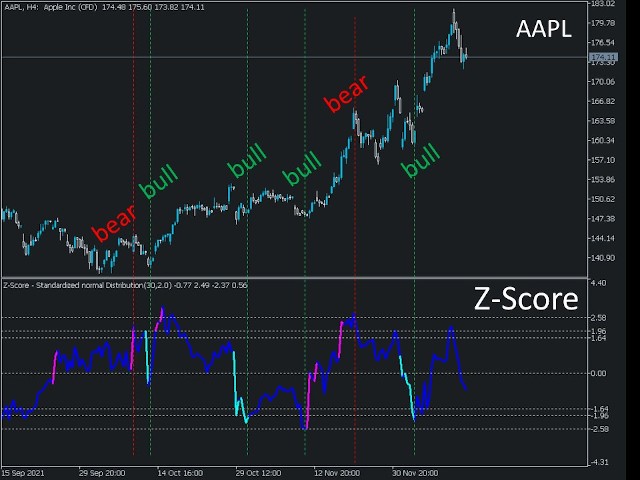
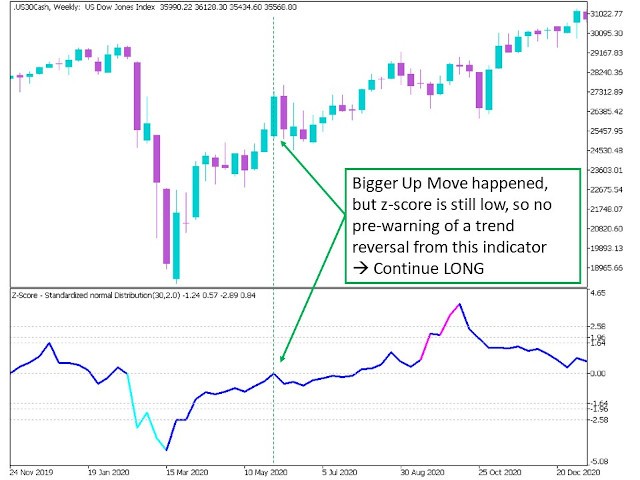
Esta curva indicadora es la línea gruesa de puntuación z (coloreada en azul). También muestra los valores atípicos, si la línea respectiva excede su banda de desviación estándar individual cambia de color. En el modo por defecto es superior a 2 SDs. Si se vuelve rosa, indica una prealerta de que podría producirse una reversión bajista. Si la línea azul se vuelve "aqua", indica una inversión alcista.
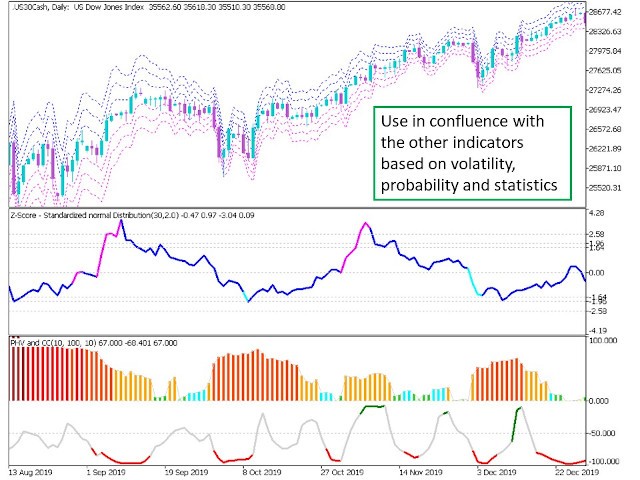
Cómo utilizarlo: Como los rendimientos son de reversión a la media, es más probable si la puntuación z es alta, que se produzca una reversión a la media. Por lo tanto, se trata de un oscilador en sentido general. También se representan los intervalos de confianza del 90%, 95% y 99%, que pueden actuar como niveles de probabilidad de que la puntuación z no supere ese nivel. Es decir, puede indicar una inversión. Por ejemplo, si la curva está cerca de la línea del 99%, sólo hay una probabilidad del 1% de que la puntuación z supere esa línea, por lo que es más probable que se produzca una inversión. Además, el cambio de color de la línea de rentabilidad (por defecto: azul) puede indicar una inversión (rosa: bajista, aqua: alcista).
Ajustes de entrada:
Tamaño de la muestra: Por defecto 30, longitud de los periodos de vuelta al z-score calculado
Multiplicador: por defecto 2.0, multiplicador en términos de desviación estándar, para mostrar valores atípicos/posibles retrocesos (cambio de color de la línea)
Observación: El indicador se proporciona únicamente para el análisis estadístico y para mostrar probabilidades, y no debe interpretarse como asesoramiento financiero.