Swiss VWAPsimple
- Indicadores
- Versión: 1.3
- Actualizado: 18 febrero 2019

Swiss VWAPsimple
Motivación
No encontrar VWAP libre que funciona, el que he encontrado craseh. Así que he creado un VWAP que calcula los valores sólo para el día real. Así que los recursos informáticos no están sobrecargados.
¿Qué es VWAP, cómo se utiliza?
VWAP significa Volume Weighed Average Price (precio medio ponderado por volumen), calcula la suma actual del volumen de ticks y la suma actual del precio por el volumen de ticks. La división de estas sumas da como resultado un precio ponderado (Suma P*V/Suma V). El cálculo comienza normalmente a medianoche. Los valores dependen en gran medida de la hora de inicio. Tenga cuidado si tiene activos que no comienzan a medianoche. También el cálculo se vuelve más y más impreciso durante el día porque las sumas se hacen más y más grandes durante el día y los errores se suman.
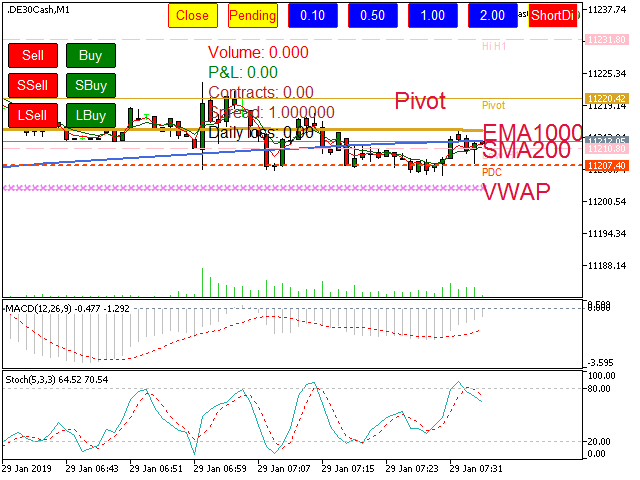
El VWAP es una especie de precio de equilibrio. Puede dividir el día en una zona de sesgo largo y corto. Recomiendo usar Puntos Pivote, SMA200 y EMA1000 además para establecer una línea divisoria de sesgo diario. Así que si usted tiene su zona larga y corta solo opere largo en la zona larga y viceversa. Usted podría ir corto en una zona larga pero el precio debe tener una distancia razonable de la línea divisoria diaria de sesgo o el VWAP.
El VWAP te muestra, también, si estás en una fase lateral si el precio está cerca del VWAP (y SMA200, SMA1000, Pivot Point).
Principio:
Zona larga extendida, cuidado con las trampas alcistas
................................................
Zona larga, no cortos
----------------------------------------------- VVAP
Zona corta, sin largos
................................................
Zona corta ampliada, cuidado con las trampas para osos
Entradas
useBarsSinceMidnight => Uso normal se establece en true, con mercados cerrados tienes que establecerlo > Punto de inicio de VWAP (número de barras hacia atrás) si useBarsSinceMidnight ist false
Mostrar comentario => mostrar comentario que muestra la distancia al vwap
Comment says that you might go short in a long area => El comentario te dice que podrías ir corto en una situación larga
Comment says that youmigt go long in a short area => El comentario le dice que usted podría ir corto en una situación corta
deja hablar al Indicador, vwap cross => Cuando el precio cruza vwap dice "vwap cross"
Define el rango de advertencia, demasiadas advertencias hazlo más pequeño => Ajuste de la advertencia, ponlo más pequeño para divisas, cuando Vwap-Distancia al precio es cero, la advertencia viene
inpArrowCode => Código de fuente Wingdings de Mt5, la cruz es el código 251
inpShowDistanceLabel => Mostrar distancia Ask-VWAP por etiqueta
XDISTANCE => Distancia para etiqueta dirección X
YDISTANCE => Distancia para etiqueta dirección Y
inpFontSize => Tamaño de fuente de la etiqueta
inpVwapText1 bis 4 => Textos para etiqueta
Marco temporal
Utilice M1 a H1. VWAP debe ser invariable a los plazos. Pero debido a errores de redondeo nunca es exactamente igual en varios marcos de tiempo.

sehr nützlich zB für daily Entscheidung, aber auch kurzfristig sinnvoll