Swing Reader
- Indicadores
-
Francesco Rubeo
 Minerva Management is a company composed by software engineers, especially in MQL4 by 6 years, and 6 years experienced traders.
 - Versión: 1.2
- Actualizado: 8 enero 2019
- Activaciones: 20
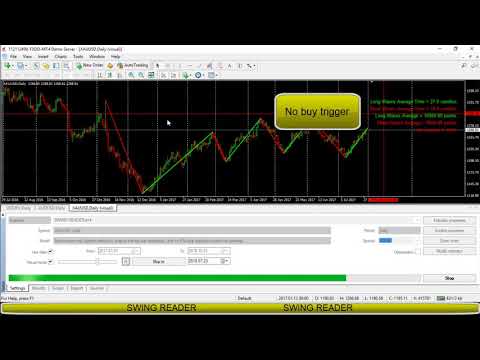
Lea el principio de la onda de Elliott automáticamente.
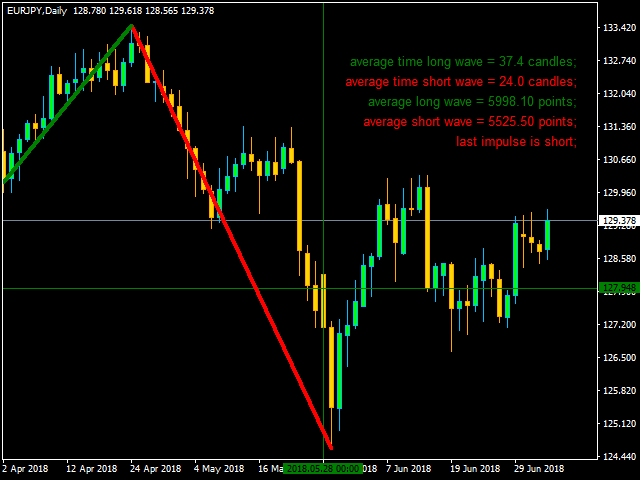
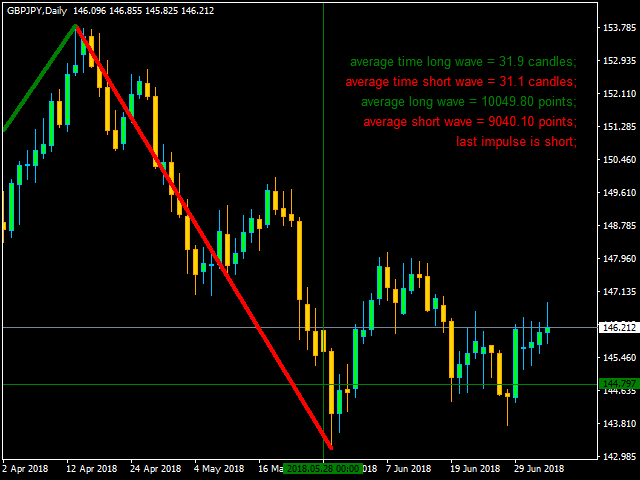
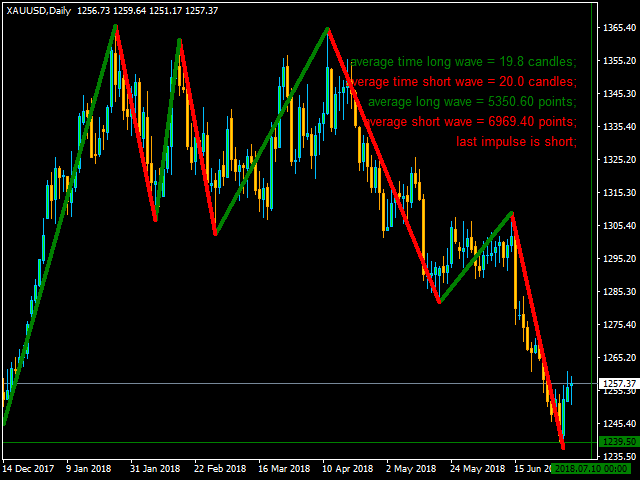
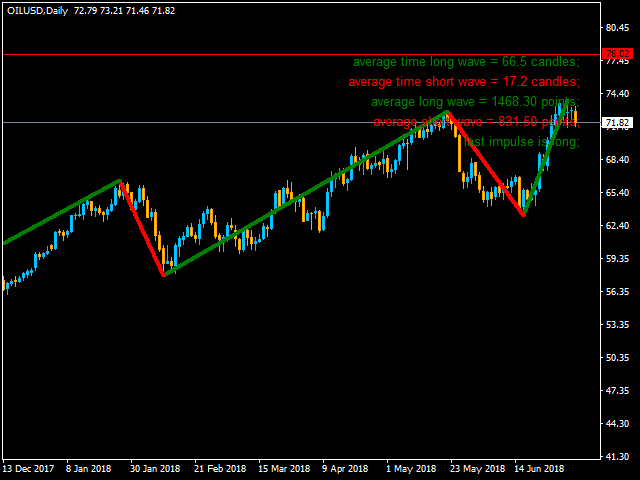
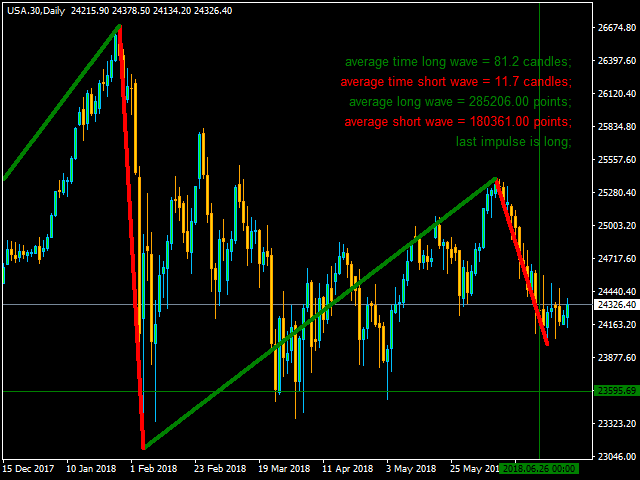
Con el Swing Reader, puede leer fácilmente el principio de la onda de Elliott a través de un sistema automático. Con swing, nos referimos a un mercado ZigZag que se crea por una ruptura de su desviación estándar. Puede establecer la desviación manualmente, o puede dejar que el indicador lo haga automáticamente (estableciendo la desviación a cero).
Ventajas que obtiene
- Nunca se repinta.
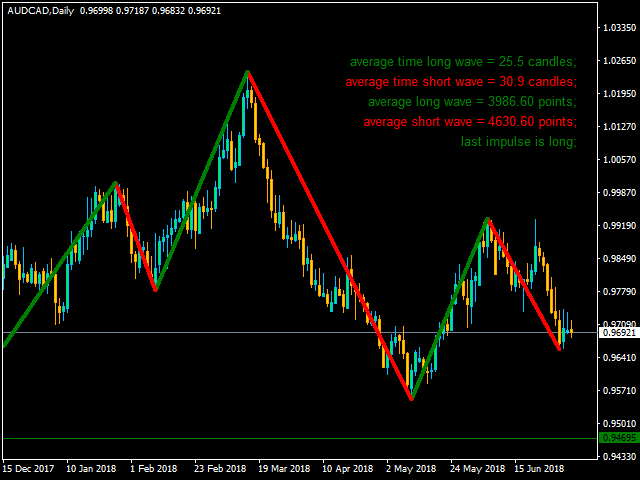
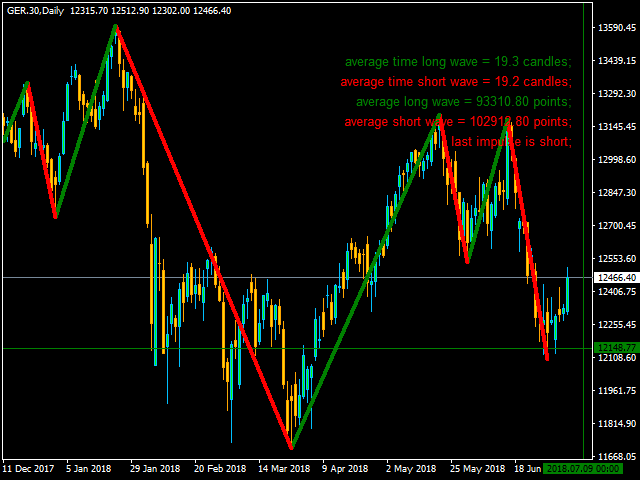
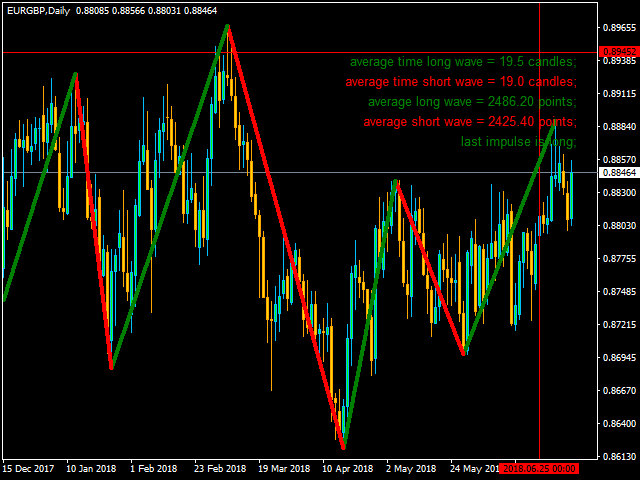
- Puntos que muestran una línea horizontal, en la que estadísticamente termina una onda larga.
- Velas que muestran una línea vertical en la que estadísticamente termina una onda larga.
- Una línea horizontal creada utilizando puntos medios que componen estadísticamente ondas cortas.
- Línea horizontal creada a partir de los puntos medios que componen las ondas estadísticamente largas.
- Posibilidad de optimizar el indicador para cada marco temporal.
Arriba a la derecha, encontrará información muy importante relativa al movimiento del mercado:
- Tiempo medio delas ondaslargas : número de velas que componen estadísticamente una onda LARGA.
- Tiempo medio delas ondas cortas: número de velas que componen estadísticamente una onda CORTA.
- Media deOndas Largas: puntos que componen estadísticamente una onda LARGA.
- Media deOndas Cortas : puntos que componen estadísticamente una onda CORTA.
- Último impulso: Si hay un impulso largo, significa que la última onda larga es mayor (en puntos) que la última onda corta; si el impulso es corto, es lo contrario.
Entradas
- Desviación: Establezca la desviación estándar para calcular la oscilación(si se establece en cero, el indicador elegirá por usted la desviación estándar).
- Método demedias: Elija el método que prefiera para calcular las medias que encontrará arriba a la derecha. Tendrá dos opciones a su disposición:
- Simple: Media aritmética.
- Lineal Pon derada: Media ponderada por las ondas másrecientes (¡¡las ondas más recientes son más importantes!!).
- Color Toros: Elija su color favorito para las ondas largas.
- Bears Color: Elija su color favorito para las ondas cortas.
- Swing Width: Elija su ancho de onda favorito.
Configuración de Notificaciones
- Usar Alerta: Si es verdadero, el indicador le enviará alertas.
- Usar Correo: Si es verdadero, el indicador le enviará correos electrónicos.
- Usar Notificaciones Push: Si es verdadero, el indicador le enviará notificaciones push.
Versión MT5-> https://mql5.com/7sb9f


Swing Reader is a great additional tool to have in your trading strategy to help identify swings and potential reversals in the market.