Swing Reader
- 지표
-
Francesco Rubeo
 Minerva Management is a company composed by software engineers, especially in MQL4 by 6 years, and 6 years experienced traders.
 - 버전: 1.2
- 업데이트됨: 8 1월 2019
- 활성화: 20
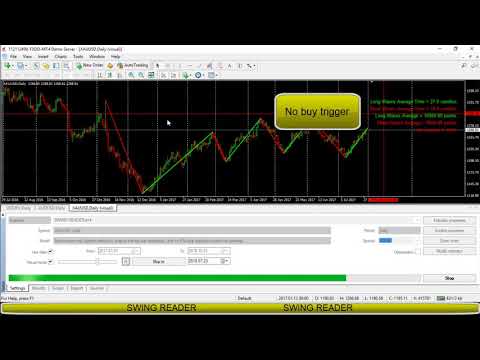
Read Elliott wave principle automatically.
With the Swing Reader, you can easily read the Elliott Wave Principle through an automatic system. With swing, we mean a ZigZag market that is created by a breakout of its standard deviation. You can set the deviation manually, or you can let the indicator do it automatically (setting the deviation to zero).
Advantages you get
- Never repaints.
- Points showing a horizontal line, in which statistically a long wave ends.
- Candles showing a vertical line in which statistically a long wave ends.
- A horizontal line created using average points composing statistically short waves.
- A horizontal line created using average points composing statistically long waves.
- Possibility to optimize the indicator for each timeframe.
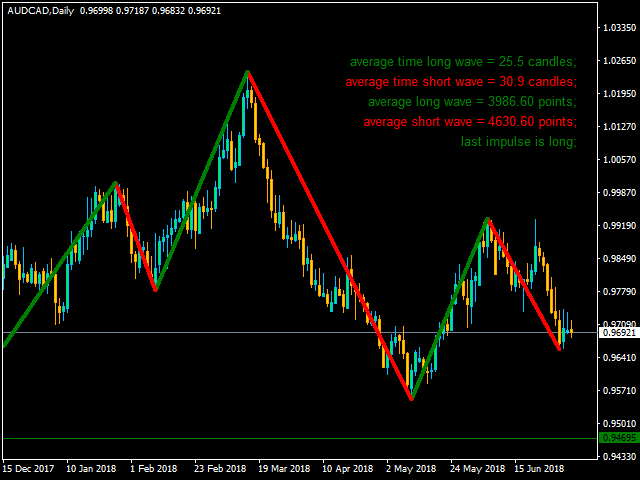
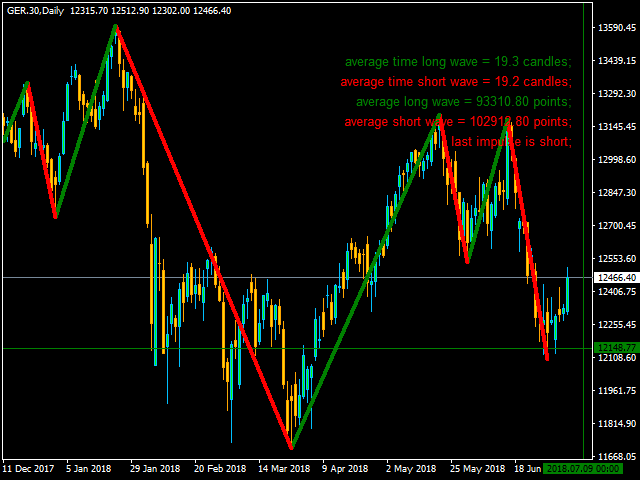
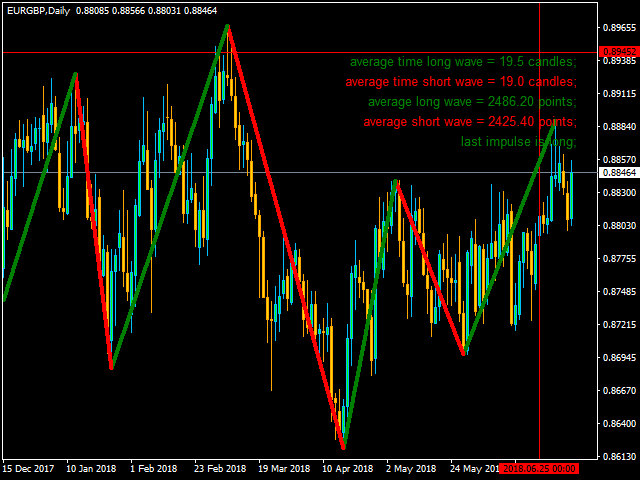
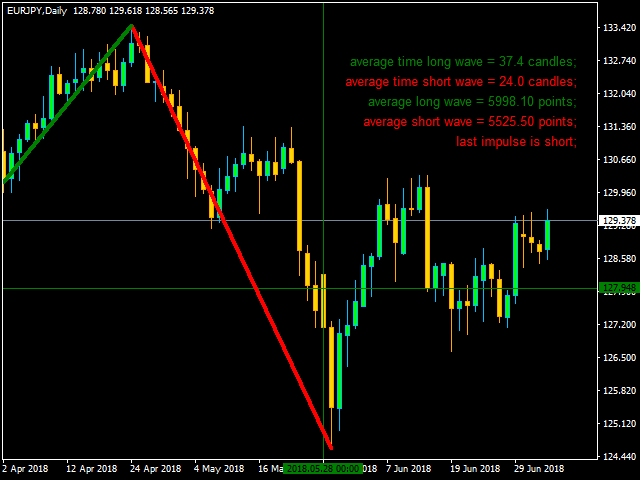
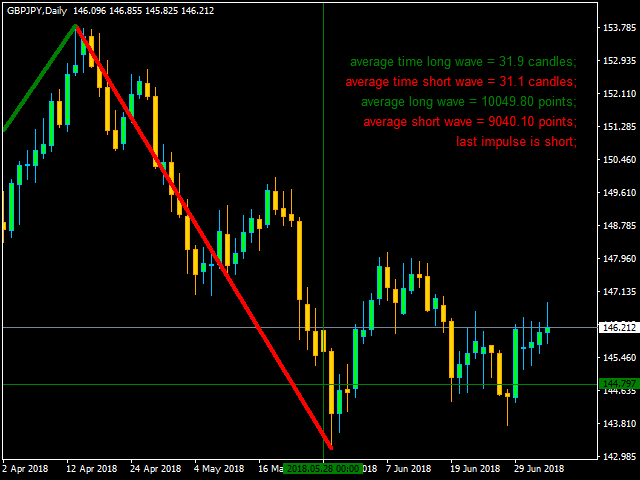
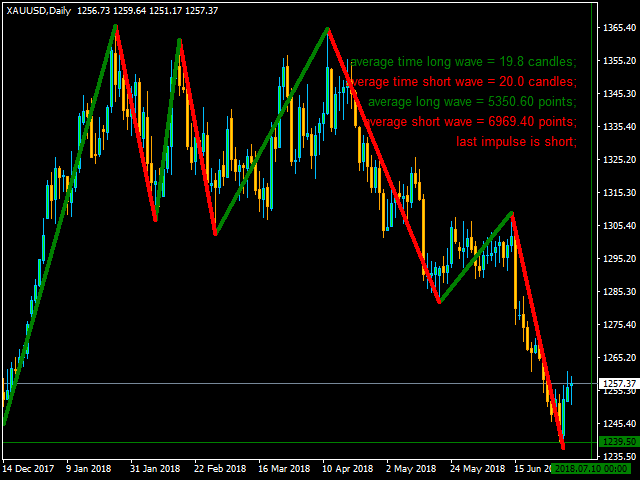
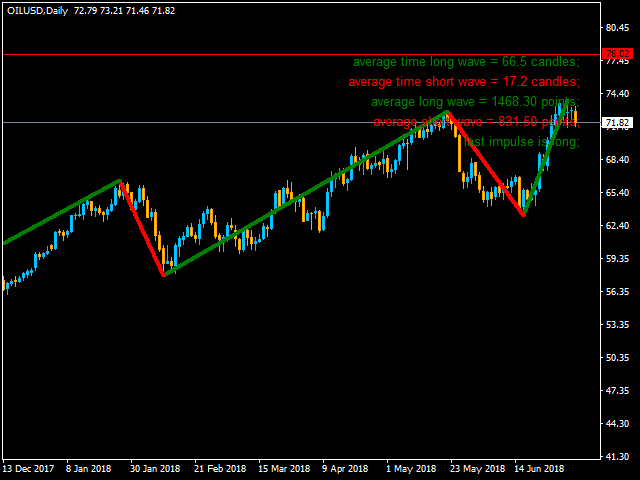
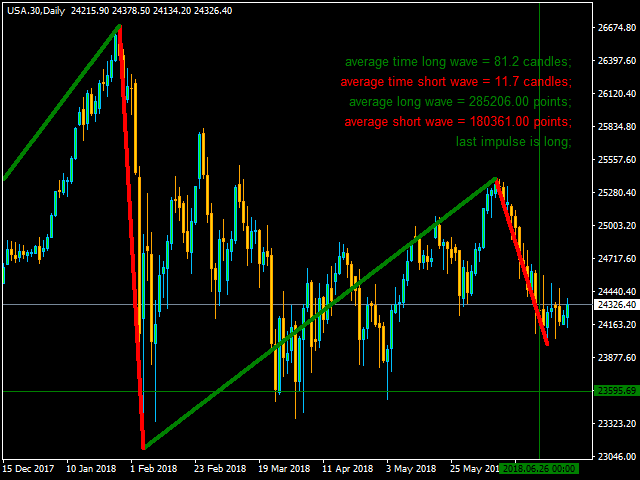
Above on the right, you will find very important information concerning the market movement:
- Long Waves Average Time: number of candles composing statistically a LONG wave.
- Short Waves Average Time: number of candles composing statistically a SHORT wave.
- Long Waves Average: points composing statistically a LONG wave.
- Short Waves Average: points composing statistically a SHORT wave.
- Last impulse: If there is a long impulse, it means that the last long wave is bigger (in points) than the last short wave; if the impulse is short, it is the opposite.
Inputs
- Deviation: Set your standard deviation to calculate the swing (if set to zero, the indicator will choose for you the standard deviation).
- Average Method: Choose your favourite method to calculate the averages that you will find above on the right. You will have two options at your disposal:
- Simple: Arithmetical average.
- Linear Weighted: An average weighted by the latest waves (newest waves are more important!!).
- Bulls Color: Choose your favourite color for long waves.
- Bears Color: Choose your favourite color for short waves.
- Swing Width: Choose your favourite waves width.
Notifications Settings
- Use Alert: If true, indicator will send you alerts.
- Use Mail: If true, indicator will send you e-mails.
- Use Push Notifications: If true, indicator will send you push notifications.


Swing Reader is a great additional tool to have in your trading strategy to help identify swings and potential reversals in the market.