Gann Swing Chart Range
- Indicadores
-
Francesco Rubeo
 Minerva Management is a company composed by software engineers, especially in MQL4 by 6 years, and 6 years experienced traders.
 - Versión: 1.0
- Activaciones: 20
| Con este indicador tendrá una lectura general del rango del mercado utilizando los modos de cálculo de Gann. |
|---|
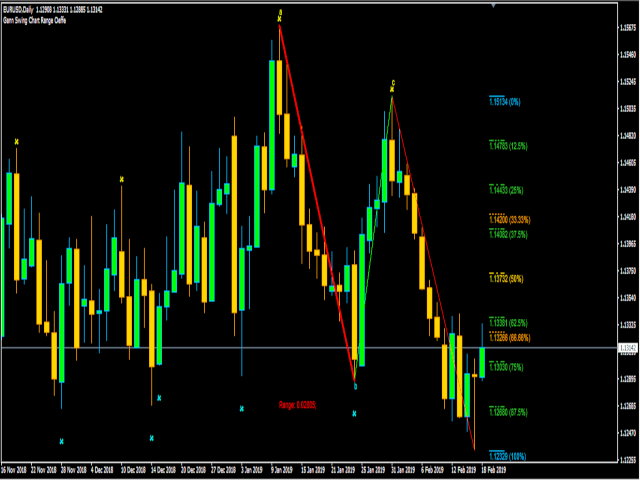
El swing de Gann se utiliza para tener una lectura rápida a primera vista de los últimos movimientos del mercado.
La base de cálculo de este swing está en el recuento de velas en relación a la ruptura y caída del precio. Cuando el precio rompe el último máximo, el swing se trazará si se supera un cierto número de velas desde el último mínimo.
Se puede utilizar un "Gann puro" o no: Si se establece en "true", el indicador no tendrá en cuenta las barras interiores en el conteo; si se establece en "false", el indicador tendrá en cuenta la barra interior en el conteo.
Este indicador también le ayudará mucho en la "lectura" del swing:
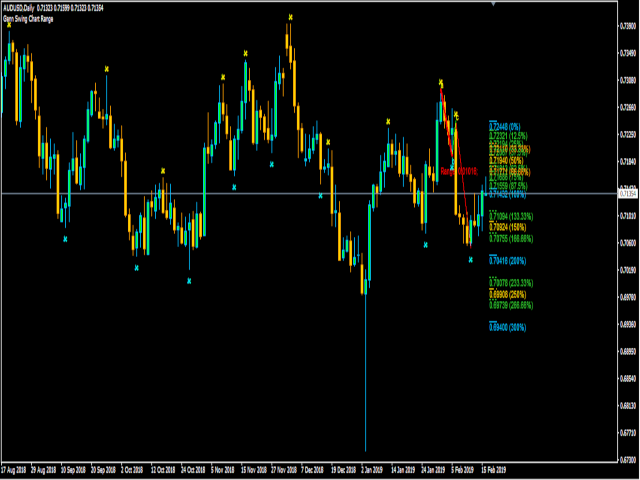
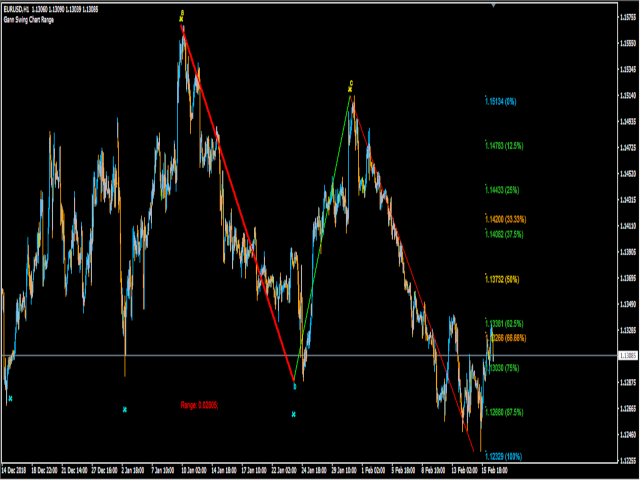
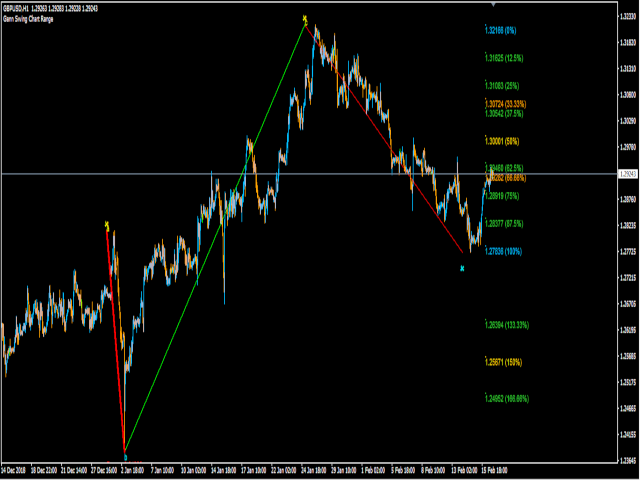
Los tres últimos swings serán resaltados, para que puedan formar el último ABC.
Le informará sobre cuántos puntos se compone el rango.
Le dará los precios sobre los que se apoya el precio, basándose en los propios swings.
Parámetros de entrada:
Time To Show: Timeframe sobre el que se aplica el indicador
Barras Swing: Número de barras sobre las que elabora el cómputo para la formación del swing.
Swing Width: Ancho de las líneas que representan el ABC.
Arrow Down Color: Color de las cruces por encima.
Arrow Up Color: Color de los cruces por debajo.
Color de Compra: Color del swing hacia arriba (ABC)
Color de Venta: Color del swing bajista (ABC)
Usar Gann Puro: Si es true usa gann puro (no inside)
Tamaño Fuente: Tamaño de la fuente en el gráfico
Tipo de Fuente: Tipo de fuente en el gráfico