MACD candles bars or lines
- Indicadores
- Versión: 1.10
- Actualizado: 6 junio 2020

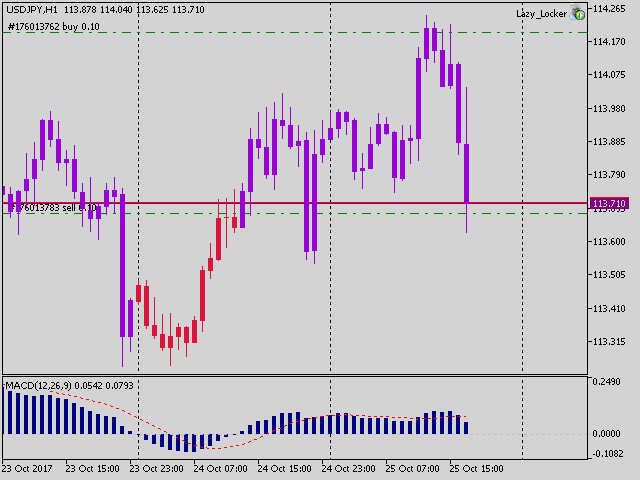
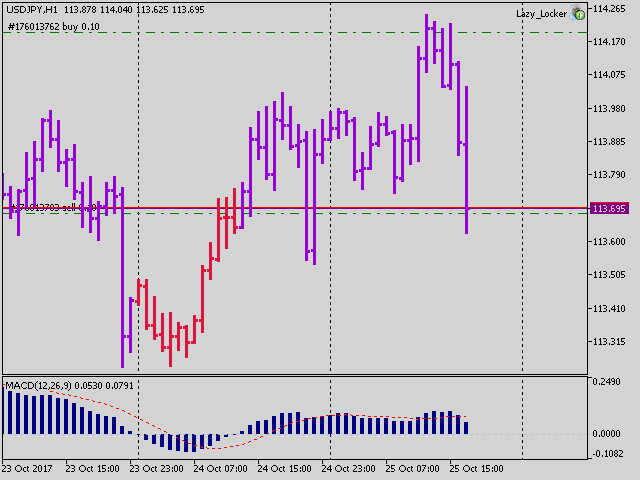
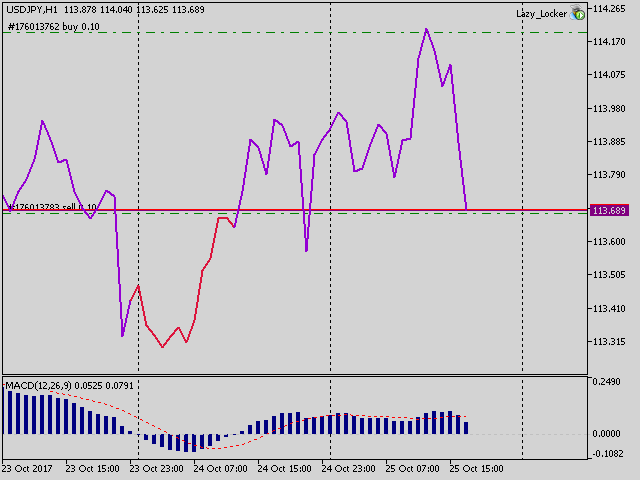
Se trata de un indicador MACD ordinario que se muestra en la ventana principal según el estilo de gráfico seleccionado, es decir, Barras, Velas o Línea.
Cuando se cambia de tipo de gráfico, la visualización del indicador también cambia.
Lamentablemente, no he podido mejorar la velocidad de cambio de tipo de gráfico. Después de cambiar, hay retrasos antes de la llegada de un nuevo tick.
Los parámetros del indicador
- Periodo EMA rápido
- Periodo EMA lento
- Periodo de señal SMA
- Precio aplicado


Excelente o indicador! Ficaria melhor se o código fosse compartilhado também