ADX by AV
- Indicadores
- Versión: 1.10
- Actualizado: 6 junio 2020

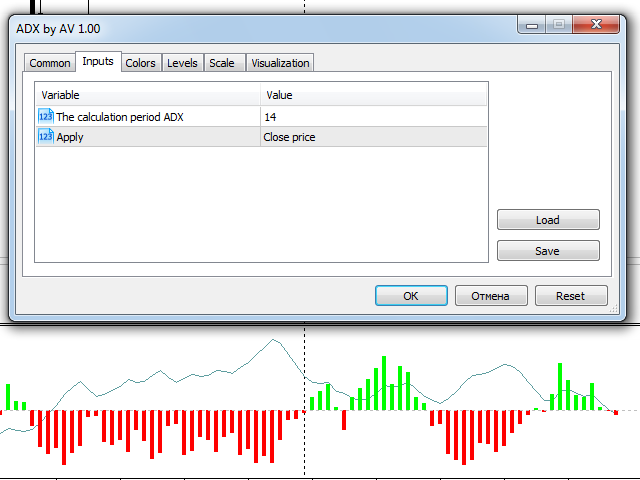
Esta es una representación inusual del Índice de Movimiento Direccional Promedio. El indicador ha sido desarrollado a petición de un trader y con el propósito de aprender el desarrollo de indicadores en MQL5.
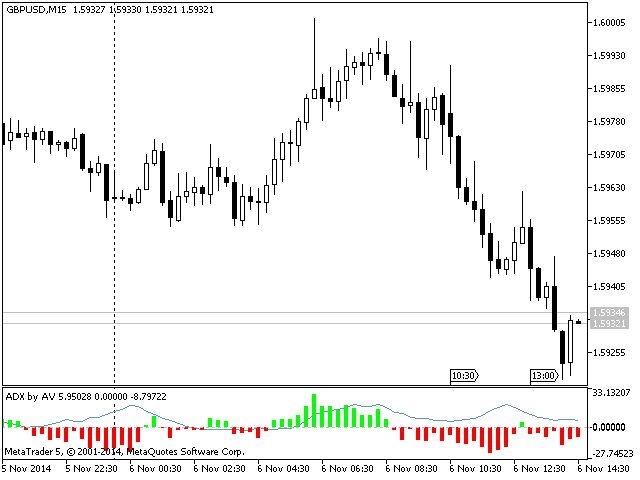
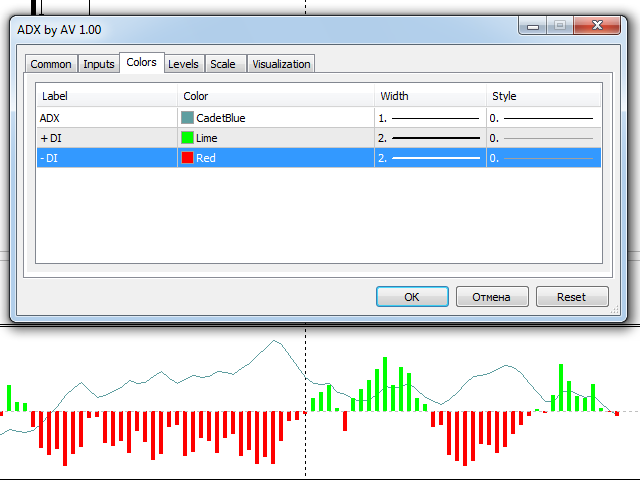
- La línea muestra lo mismo que el Índice de Movimiento Direccional Promedio (ADX) estándar;
- El histograma ascendente muestra la diferencia entre +DI y -DI, cuando +DI está por encima de -DI;
- El histograma descendente muestra la diferencia entre +DI y -DI, cuando +DI está por debajo de -DI.


GOOD