KT Pin Bar MT5
- Indicadores
-
KEENBASE SOFTWARE SOLUTIONS
 Keenbase Trading desarrolla indicadores profesionales y Asesores Expertos (Expert Advisors) para MetaTrader 4 y MetaTrader 5, diseñados para ayudar a los traders a tomar decisiones de trading más informadas.
 - Versión: 1.2
- Actualizado: 21 septiembre 2022
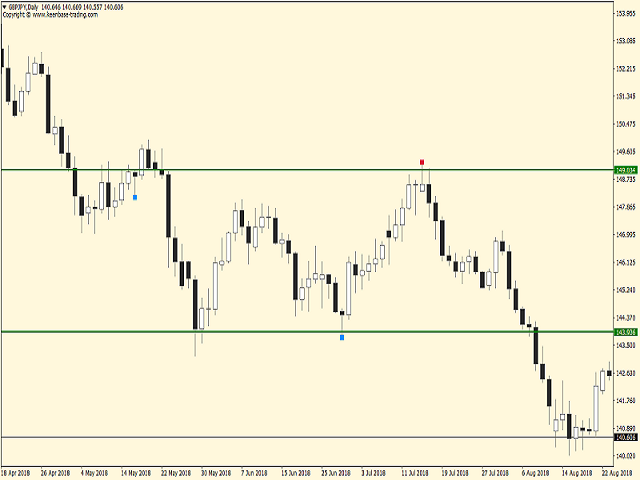
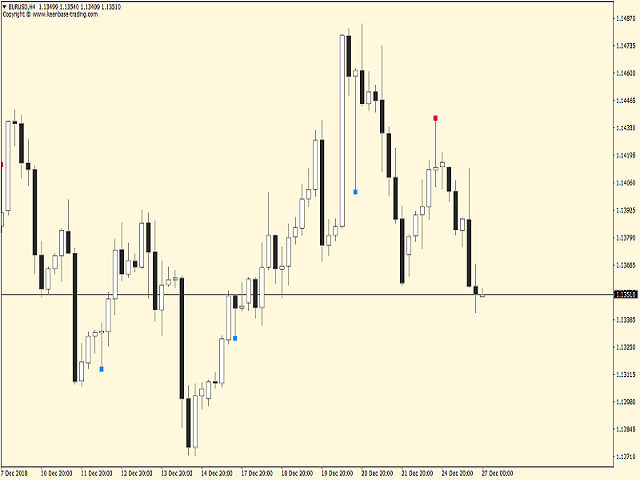
KT Pin Bar identifica la formación pin bar que es un tipo de patrón de acción de precios que representa una señal de reversión o rechazo de la tendencia. Cuando se combina con soporte y resistencia, BRN y otros niveles significativos, el patrón Pin Bar demostró ser una señal muy fuerte de reversión.
Básicamente, una pin bar se caracteriza por un cuerpo pequeño en relación con la longitud de la barra que se cierra en la parte superior o inferior del 50% de su longitud. Tienen mechas muy grandes y un cuerpo de vela pequeño.
Una vela pin bar puede ser alcista o bajista, pero mientras su estructura cumpla con los caracteres de una pin bar perfecta, el color de la vela no importa realmente.
La versión MT4 del mismo indicador está disponible aquí KT Pin Bar MT4
Características
- Muestra puntos de reversión significativos cerca del nivel de soporte/resistencia.
- Adecuado para estrategias de swing trading.
- Define el tamaño máximo y mínimo de la vela en pips.
- Alertas incluidas.
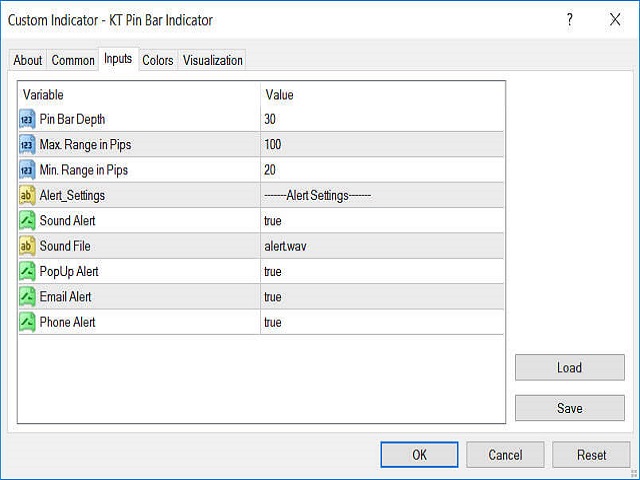
Parámetros de entrada
- Profundidad de la Pin Bar: Define el ratio nariz/cuerpo en porcentaje.
- Máx. Rango en Pips: Tamaño máximo para la barra pin.
- Mín. Rangoen Pips: Tamaño mínimo de la barra.
- El resto de entradas se explican por sí mismas.