Tools Standard
- Indicadores
- Versión: 1.27
- Actualizado: 23 julio 2024
- Activaciones: 7

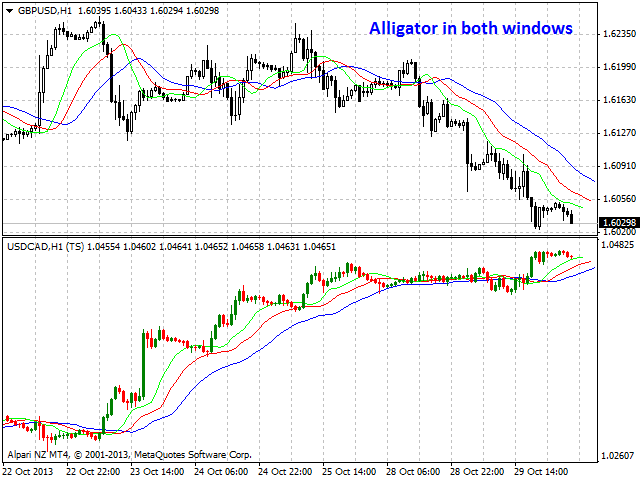
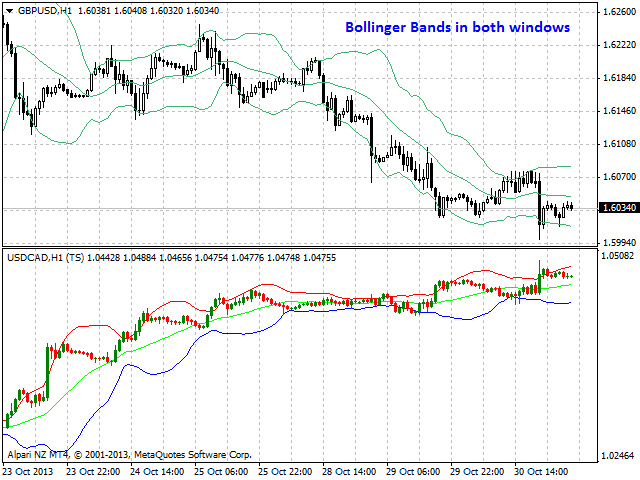
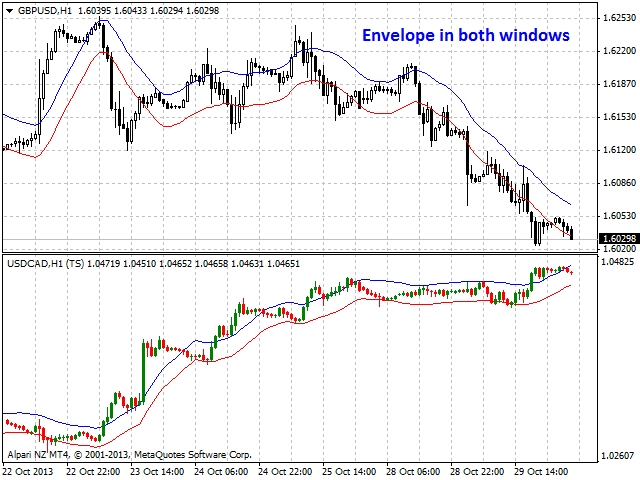
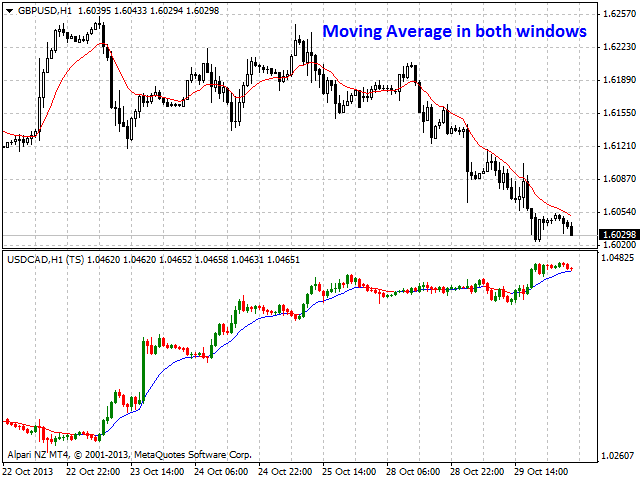
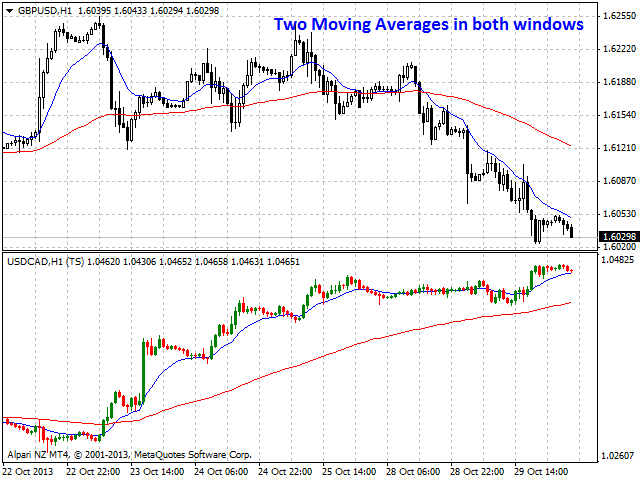
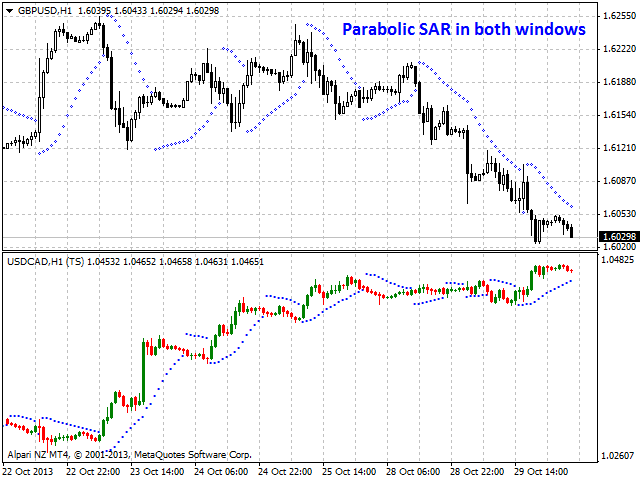
Tools Standard es un indicador multidivisa/multisímbolo a color diseñado para mostrar uno de los siete indicadores estándar en un gráfico de velas en una ventana separada bajo el gráfico de símbolos base.
El indicador puede calcularse en base a uno de los siete indicadores según las preferencias del usuario:
- Bill Williams Alligator
- Bandas de Bollinger
- Envolventes
- Fractales Bill Williams
- Media móvil
- Dos Medias Móviles
- SAR Parabólico.
Bill Williams Alligator se utiliza por defecto.
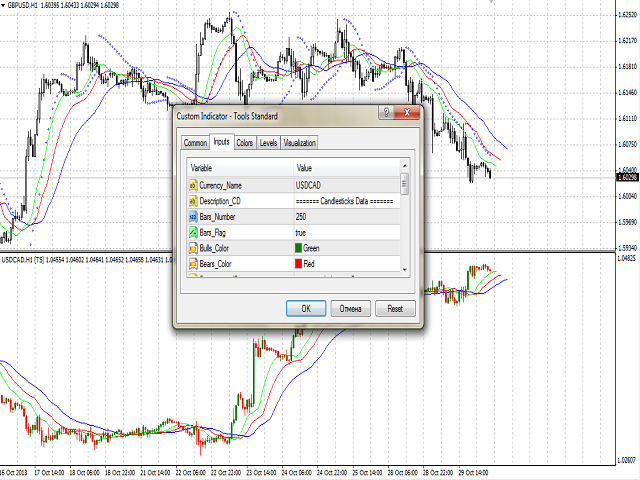
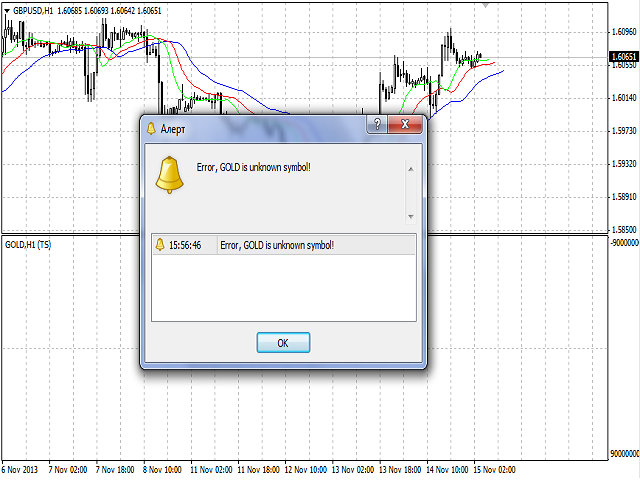
El indicador puede utilizarse con cualquier broker, independientemente del nombre del instrumento financiero, ya que es necesario introducir manualmente el nombre como parámetro de entrada. Si introduce un nombre inexistente o incorrecto de un instrumento financiero, recibirá un mensaje de error que le indicará que este instrumento financiero es desconocido (no existe).
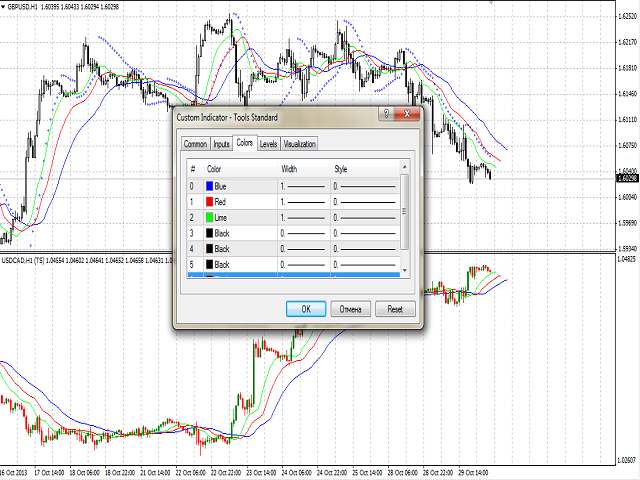
Los usuarios también pueden establecer el número de velas mostradas, así como seleccionar los colores alcistas y bajistas, incluyendo los colores de las líneas del indicador aplicado.
Finalidad
El indicador puede ser utilizado como una herramienta visual que representa los datos del mercado de una manera más informativa, como se muestra en las capturas de pantalla, mejorando el análisis de eventos del mercado.
El indicador se puede utilizar para el comercio manual o automatizado dentro de un Asesor Experto. Para el trading automatizado, utilice el buffer del indicador de tipo doble:
- Buffer 0 en función del índice Ind_Number - valores del indicador:
- Mandíbula de cocodrilo
- La línea inferior de las Bandas de Bollinger
- La línea superior de la Envolvente
- El fractal superior de Bill Williams
- Media móvil
- Media móvil rápida
- Valores del SAR parabólico
- Buffer 1 en función del índice Ind_Number - valores del indicador:
- Dientes de cocodrilo
- La línea superior de las Bandas de Bollinger
- La línea inferior de la Envolvente
- Fractal inferior de Bill Williams
- Línea alcista de la Media Móvil - el valor no debe ser igual a cero
- Media Móvil Lenta
- Buffer 2 en función del índice Ind_Number - valores del indicador:
- Labios de cocodrilo
- Línea media de las Bandas de Bollinger
- Línea bajista de la Media Móvil - el valor no debe ser igual a cero
- Buffer 3 - valores del indicador en los precios de apertura
- Buffer 4 - valores del indicador a precios altos
- Buffer 5 - valores del indicador a precios bajos
- Buffer 6 - valores del indicador a precios de Cierre
Parámetros de entrada
- Currency_Name - nombre del instrumento financiero
- Bars_Number - número de barras para mostrar en una ventana separada
- Bars_Flag - indicador que permite mostrar el número de barras establecido en el parámetro Bars_Number:
- true - según Bars_Number
- false - número máximo disponible de barras en el historial
- Bulls_Color - color de la vela alcista
- Bears_Color - color de la vela bajista
- Bid_Line_Color - color de la línea Bid.
- Ind_Number - número de indicador (de 0 a 6). Por defecto se utiliza el indicador de fuerza (es decir, más de 3)
- Fast_Period - período rápido
- Slow_Period - periodo lento
- Jaw_Period - periodo medio de la línea azul (mandíbulas de caimán)
- Jaw_Shift - desplazamiento de la línea azul con respecto al gráfico de precios
- Teeth_Period - línea roja (Alligator's Teeth) período de promediación
- Teeth_Shift - desplazamiento de la línea roja respecto al gráfico de precios
- Lips_Period - línea verde (Alligator's Lips) período de promediación
- Lips_Shift - desplazamiento de la línea verde con respecto al gráfico de precios
- MA_Method - método de promediación del indicador básico:
- MODE_SMA - 0
- MODE_EMA - 1
- MODE_SMMA - 2 (por defecto)
- MODE_LWMA - 3
- Applied_Price - precio utilizado:
- PRICE_CLOSE - 0
- PRICE_OPEN - 1
- PRECIO_ALTO - 2
- PRECIO_BAJO - 3
- PRICE_MEDIAN - 4 (por defecto)
- PRECIO_TÍPICO - 5
- PRECIO_PONDERADO - 6
- Deviation_Bands - desviación de la línea principal para las Bandas de Bollinger
- Deviation_Envelope - desviación de la línea principal en % para Envelopes
- SAR_Step - incremento del nivel de stop para SAR Parabólico
- SAR_Maximum - nivel máximo de stop para SAR Parabólico
- Shift - desplazamiento del indicador básico y calculado con respecto al gráfico de precios
Limitaciones
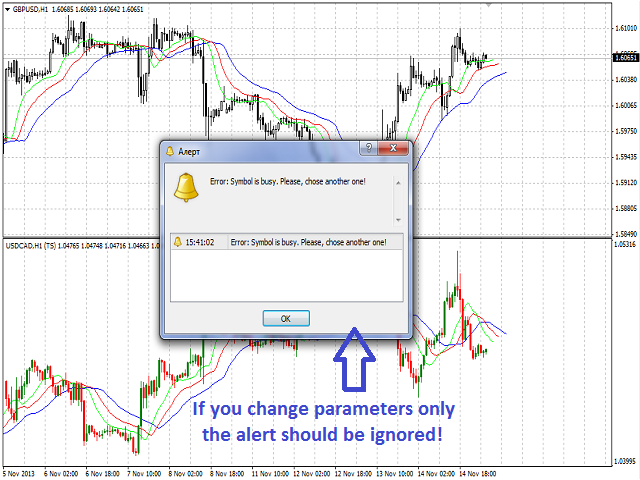
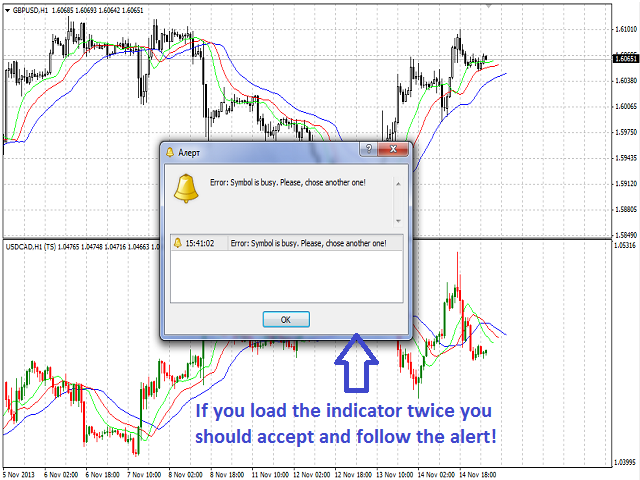
Un gráfico con parámetros similares en el mismo símbolo sólo puede mostrarse una vez. De lo contrario, se produce un error relacionado con su reutilización. Se muestra un mensaje de error apropiado y se propone sustituir un símbolo. Sin embargo, este mensaje de error debe ignorarse cuando sólo se modifican los parámetros del indicador de cálculo (ya creado en la ventana) (ver capturas de pantalla).
Recomendaciones
Se recomienda utilizar el indicador con el parámetro Bars_Number que no exceda el número de barras que caben en una ventana completa (unas 250 barras).
Nota
En caso de pérdida de conexión con el servidor comercial, el gráfico se vuelve a dibujar desde el principio utilizando el número de barras establecido por los parámetros Bars_Number y Bars_Flag una vez restablecida la conexión y realizado el intercambio de datos.