Averaging
- Indicadores
- Versión: 2.2
- Actualizado: 27 octubre 2022
- Activaciones: 8

El indicador de promediación está diseñado para operadores que operan utilizando técnicas de promediación o que de vez en cuando necesitan salir de una pérdida flotante resultante de operaciones erróneas promediando los resultados de las operaciones.
Promediar los resultados significa cerrar las operaciones por el TakeProfit calculado por el indicador.
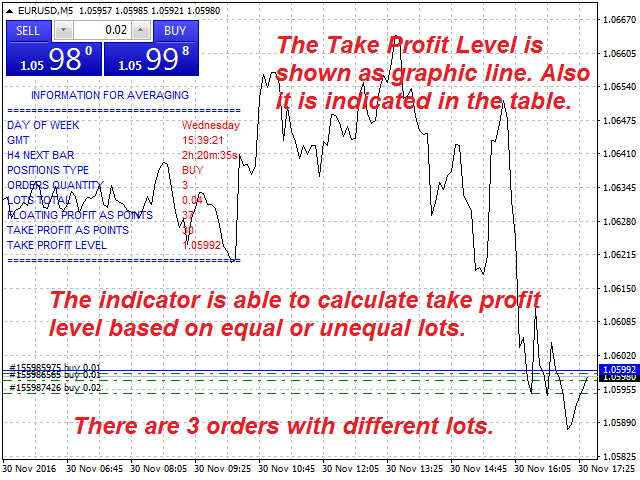
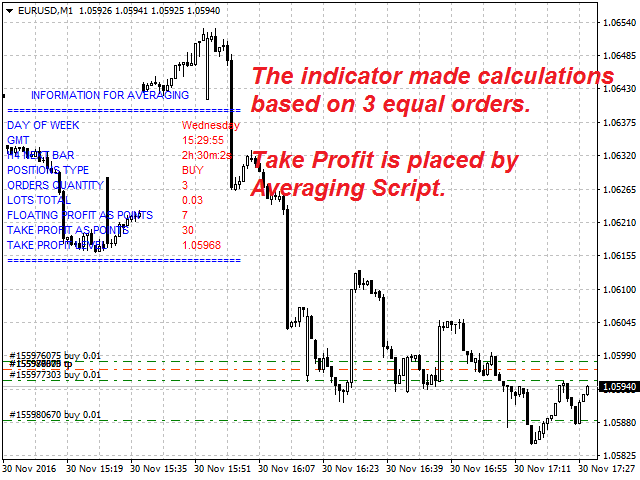
El indicador tiene en cuenta el volumen de las posiciones abiertas. Cuando el número o volumen de operaciones se incrementa o reduce, el nivel de TakeProfit se recalcula automáticamente.
El nivel de TakeProfit recomendado se muestra en la tabla, y puede mostrarse como una línea horizontal en el gráfico de símbolos. El resultado total de las operaciones se establece en puntos en las entradas del indicador y depende de lo que necesite el operador: pérdida permitida, punto de equilibrio o beneficio.
¡El TakeProfit calculado es una recomendación para establecer el valor calculado para todas las posiciones! La colocación del nivel para las órdenes es posible cuando se utiliza el Script de Promedio apropiado.
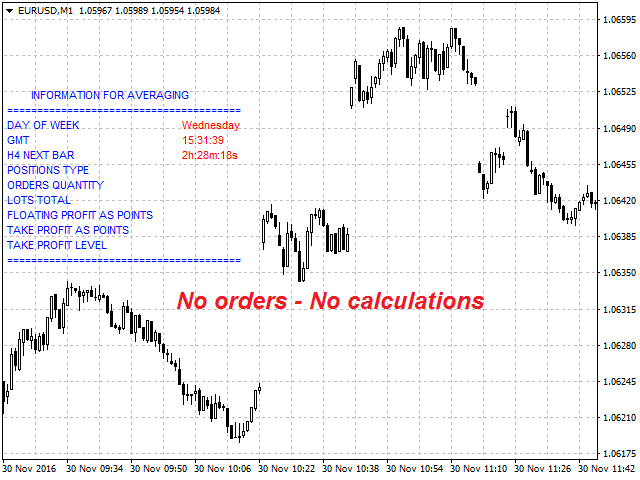
El indicador sólo funciona con órdenes de mercado y realiza cálculos cuando hay al menos dos operaciones del mismo carácter: alcista o bajista. No realiza cálculos cuando las operaciones son contrarias.
El indicador proporciona información adicional necesaria para operar como se muestra en las capturas de pantalla.
El funcionamiento del indicador se muestra en el vídeo adjunto. El nivel de TakeProfit se muestra como una línea horizontal azul que se ajusta en el gráfico cuando se abren nuevas operaciones.
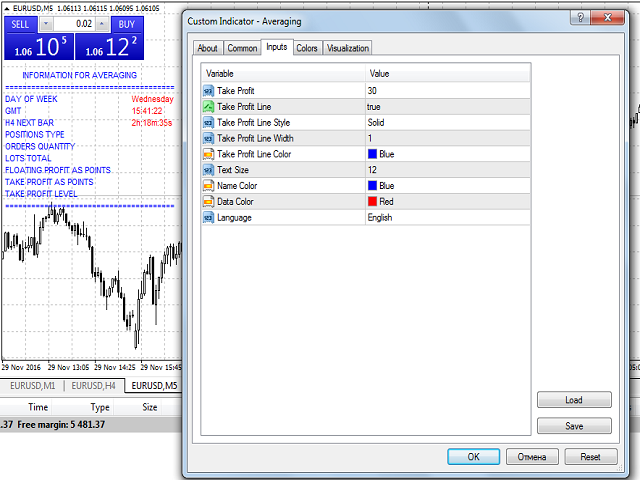
Entradas
- Take Profit - el nivel de Take Profit en puntos.
- Línea Take Profit - muestra la línea Take Profit en el gráfico:
- true - sí.
- false - no.
- Estilo de la Línea Take Profit
- Ancho de la línea Take Profit
- Color de la línea Take Profit
- Tamaño del Texto - tamaño de la fuente para el texto de información.
- Color del Nombre - el color para los nombres de las etiquetas.
- Color de Datos - el color para los valores.
- Idioma - elija el idioma para la información mostrada:
- Inglés.
- Ruso.