Averaging
- Indikatoren
- Version: 2.2
- Aktualisiert: 27 Oktober 2022
- Aktivierungen: 8

Der Averaging-Indikator wurde für Händler entwickelt, die mit Mittelwertbildungstechniken handeln oder von Zeit zu Zeit einen gleitenden Verlust ausgleichen müssen, der aus fehlerhaften Geschäften resultiert, indem sie die Handelsergebnisse mitteln.
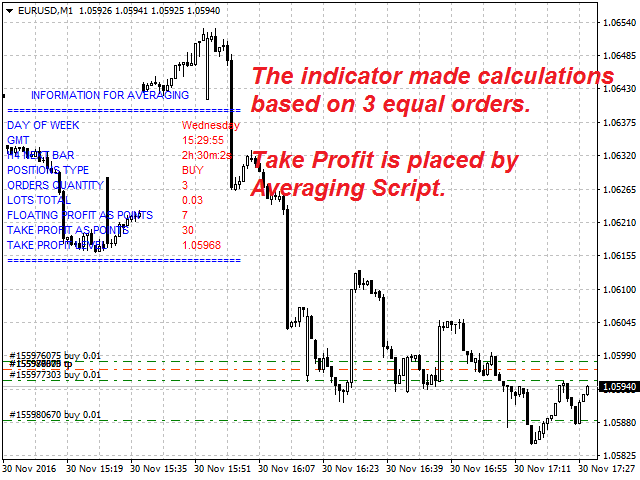
Die Mittelwertbildung der Ergebnisse bedeutet, dass die Geschäfte mit dem vom Indikator berechneten TakeProfit geschlossen werden.
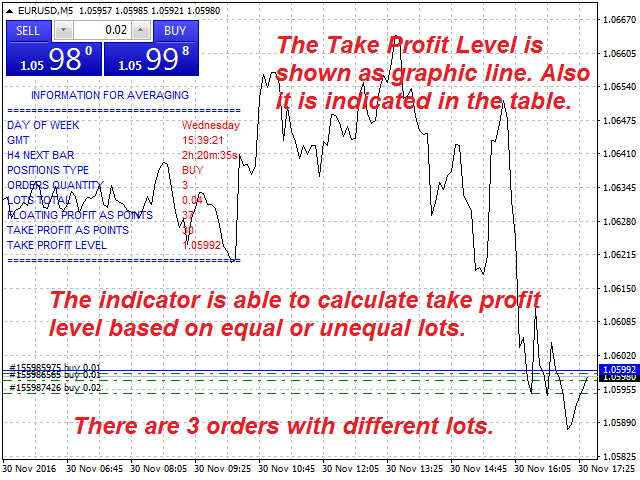
Der Indikator berücksichtigt das Volumen der eröffneten Positionen! Wenn die Anzahl oder das Volumen der Trades erhöht oder reduziert wird, wird das TakeProfit-Niveau automatisch neu berechnet!
Das empfohlene TakeProfit-Level wird in der Tabelle angezeigt und kann als horizontale Linie auf dem Symbolchart dargestellt werden. Das Gesamtergebnis der Trades wird in Punkten in den Indikatoreingaben festgelegt und hängt davon ab, was der Trader benötigt: zulässiger Verlust, Break-even oder Gewinn.
Der berechnete TakeProfit ist eine Empfehlung, den berechneten Wert für alle Positionen zu setzen! Die Platzierung des Levels für Orders ist möglich, wenn das entsprechende Averaging Script verwendet wird.
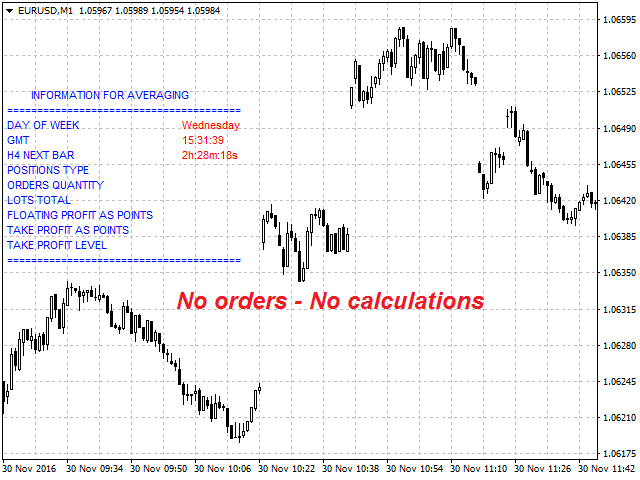
Der Indikator arbeitet nur mit Market Orders und führt Berechnungen durch, wenn mindestens zwei Trades des gleichen Charakters vorhanden sind: bullish oder bearish. Er führt keine Berechnungen durch, wenn die Trades gegenläufig sind!
Der Indikator liefert zusätzliche Informationen, die für den Handel erforderlich sind, wie in den Screenshots gezeigt.
Die Funktionsweise des Indikators wird in dem beigefügten Video demonstriert. Das TakeProfit-Level wird als blaue horizontale Linie angezeigt, die auf dem Chart angepasst wird, wenn neue Trades eröffnet werden.
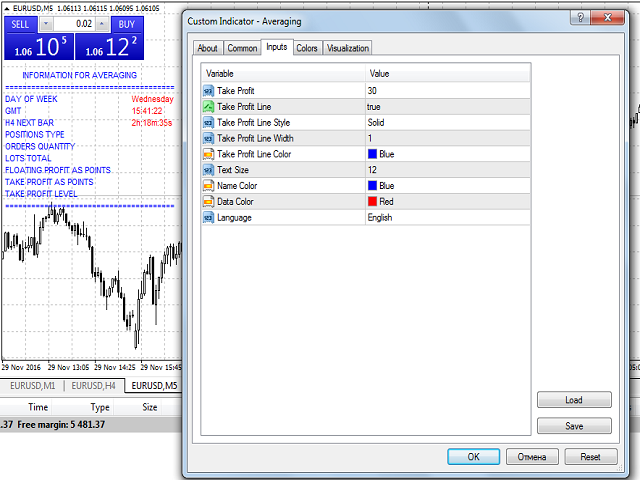
Eingaben
- Take Profit - das Take Profit-Niveau in Punkten.
- Take Profit Line - zeigt die Take Profit-Linie auf dem Chart an:
- true - ja.
- falsch - nein.
- Stil der Gewinnmitnahmelinie
- Breite der Gewinnmitnahmelinie
- Farbe der Gewinnmitnahme-Linie
- Textgröße - Schriftgröße für den Informationstext.
- Namensfarbe - die Farbe für die Namen der Etiketten.
- Datenfarbe - die Farbe für die Werte.
- Sprache - Wählen Sie die Sprache für die angezeigten Informationen:
- Englisch.
- Russisch.