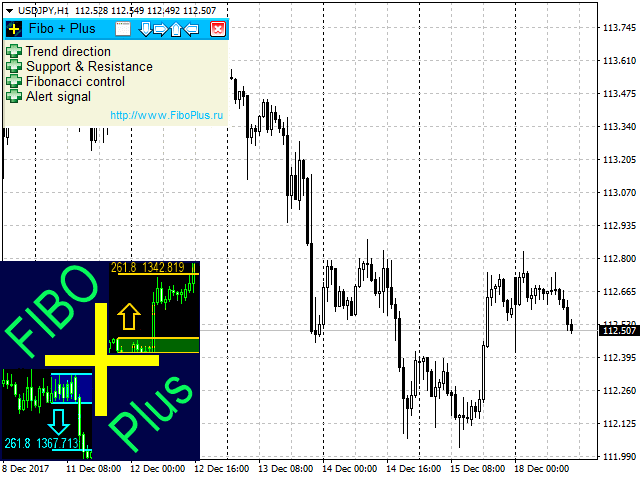
FiboPlus
- Indicadores
-
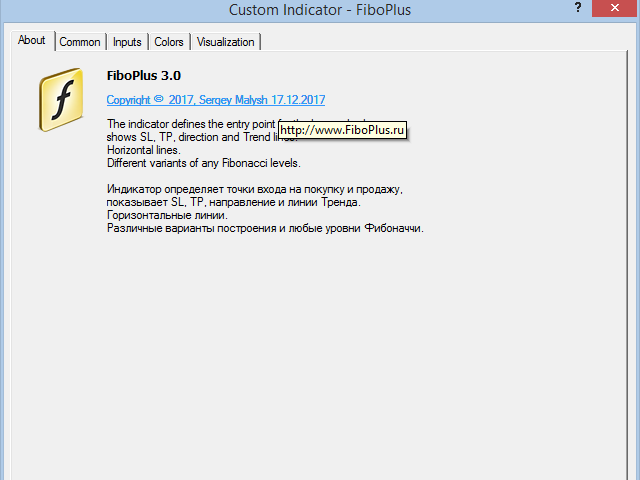
Sergey Malysh
 Conocimiento y experiencia profesional:
- Programador.
- Comerciante de la divisa
- Jefe de Contabilidad.
- Director de Finanzas.
- Director General. - Versión: 3.1
- Actualizado: 28 abril 2020
- Activaciones: 5
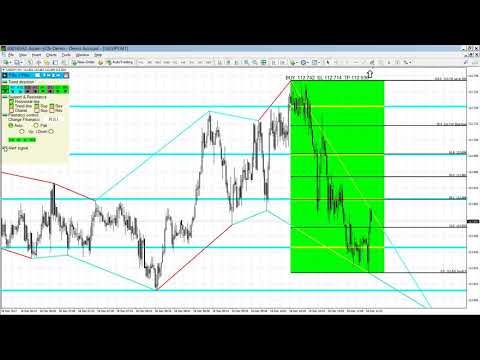
Un sistema comercial listo para usar basado en la construcción automática y el mantenimiento de los niveles de Fibonacci para la venta y compra de cualquier instrumento (símbolo) y en cualquier período del cuadro. Determinación de la dirección de la tendencia (14 indicadores). Construcción de niveles horizontales, líneas de soporte y resistencia, canales. Elegir una variante para calcular los niveles de Fibonacci (6 métodos diferentes). Sistema de alerta (en pantalla, correo electrónico, notificaciones push).
Botones
- cambiando el estilo del entorno de color.
- «flechas». Movimiento de menú al lugar concreto en el gráfico.
- Trend direction. Cálculo de dirección de tendencia en cada time-frame. Se utilizan los indicadores (RSI, Stochastic, MACD, ADX, BearsPower, BullsPower, AO, WPR, MA - 5,10,20,50,100,200).
- Support & Resistance.
- Horizontal line. Formación de niveles horizontales.
- Trend line. Formación de líneas de tendencia
- SUP. apoyo.
- RES. resistencia .
- Chanel. canalización.
- SUP. apoyo.
- RES. resistencia .
- Fibonacci control.
- Сhange Fibonacci. Elección de la opción de calcular los niveles de Fibonacci para la venta y la compra para 6 cálculos diferentes.
- Auto. Por tendencia calculada.
- Flat. Compras y ventas.
- Up. Solo compras.
- Down. Solo ventas.
- Vista de los algoritmos construidos por un algoritmo (Change Fibonacci) de otras variantes:
- |< el primero.
- < anterior.
- > el próximo.
- >| el último.
- Alert signal. Señales comerciales actuales.
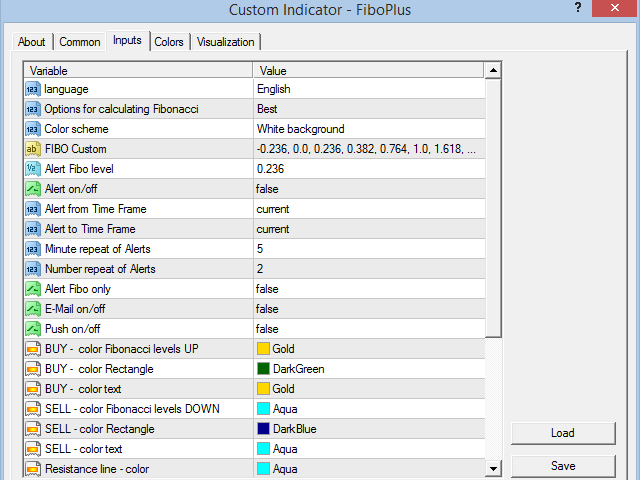
Parámetros
- Language (Russian, English, Deutsch, Espanol, Portugues)
- Posible imposición de los niveles de Fibonacci:
- Best para las velas del mismo color antes de la primera vela del color opuesto,
- Standard construcción estándar.
- debt of flow El hilo de la deuda del creador de mercado recibido cuando se activan las deformidades fuertes del mercado.
- Impulse basado en el indicador Awesome Oscillator
- Zig_Zag basado en el indicador Zig_Zag
- RSI basado en el indicador Relative Strength Index
- Color scheme La combinación de colores (color preestablecido):
- White background para el fondo blanco.
- Black background para un fondo negro.
- Custom background Ajuste personalizado de todos los colores.
- FIBO Custom (valor de niveles a través de «,»)
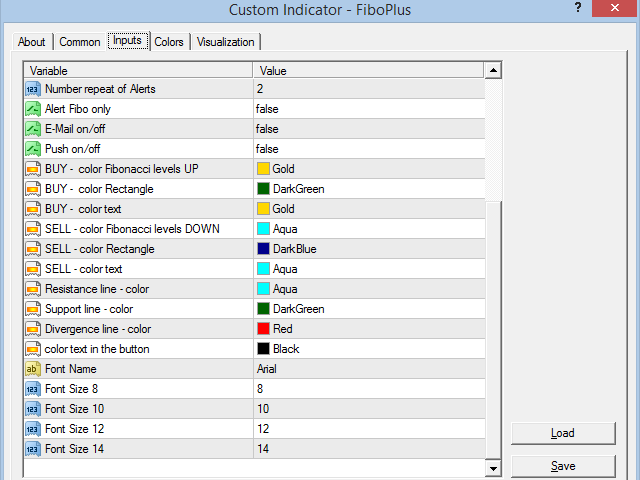
- User Fibo level Alert retroceso de usuario de Fibonacci para alertas;
- Alert on/off Alertas (encender/apagar);
- Alert from Time Frame, Alert to Time Frame - Time-frame para el funcionamiento de alertas;
- Minute repeat of Alerts repetición de alertas en cierta cantidad de minutos;
- Number repeat of Alerts cantidad de repeticiones de alertas;
- Alert Fibo only Alertas sólo según los retrocesos de Fibonacci;
- E-Mail on/off Enviar alertas en E-Mail;
- Push on/off Enviar alertas a través de notificaciones Push.
- Ajuste personalizado de todos los colores
- BUY - color Fibonacci levels UP, BUY - сolor Rectangle, BUY - сolor text,
- SELL - color Fibonacci levels DOWN, SELL - сolor Rectangle, SELL - color text,
- Resistance line - color, Support line - color,
- Divergence line - color, color text in the button
- Configuración y tamaño de letra
- Font Name - nombre de la fuente
- Font Size 8, 10, 12, 14 - tamaño de fuente
El sistema de comercio se basa en el indicador
- Venta de venta cuando la vela cierra por debajo del nivel Fib 100, con un stop-loss por encima del nivel de 76,4, más el valor de la propagación del instrumento seleccionado.
- Compra. Comprar cuando la vela cierra por encima del nivel Fib 100, con un stop-loss por debajo del nivel de 76,4 menos la propagación del instrumento seleccionado.
- Compra / Venta en el área rectangular limitada niveles de 0 a 100, puede abrir posiciones a partir de un mismo nivel y de cierre en el enfoque al siguiente nivel de la frente.
- Entrada temprana al mercado. La entrada a la vela siguiente, después de la formación de un nuevo cálculo de Fibonacci, detiene la pérdida -23.6 (menos-23.6) o más allá del nivel horizontal.


Renting for a month to see how I like it.