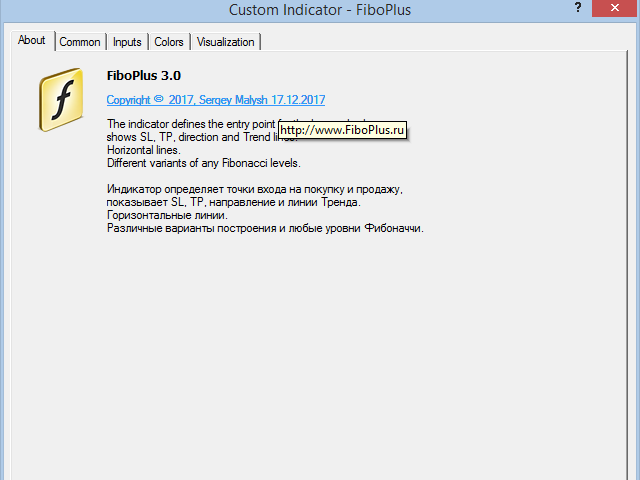
FiboPlus
- 지표
-
Sergey Malysh
 Professional knowledge and experience:
- Programmer.
- Forex Trader
- Chief Accountant.
- Chief Financial Officer.
- CEO. - 버전: 3.1
- 업데이트됨: 28 4월 2020
- 활성화: 5
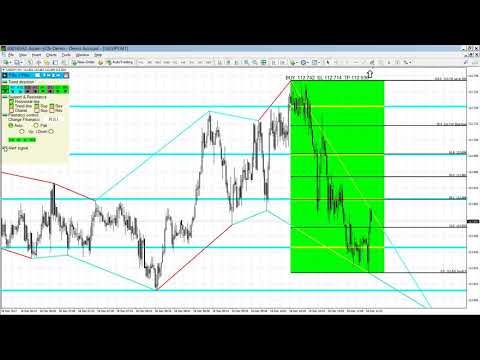
A ready-made trading system based on automatic construction and maintenance of Fibonacci levels for selling and buying for use on any instrument (symbol) and on any period of the chart.
Features
- Detection of trend direction (14 indicators)
- Construction of horizontal levels, support and resistance lines, channels
- Selection of a variant for calculating Fibonacci levels (six different methods)
- Alert system (on screen, E-Mail, Push notifications)
Buttons
- Color scheme switching button.
- Arrow buttons. Moving menu to any random point on a chart.
- "Trend direction". Calculation of trend direction on each timeframe. Indicators are used (RSI, Stochastic, MACD, ADX, BearsPower, BullsPower, AO, WPR, MA - 5, 10, 20, 50, 100, 200).
- "The name of the timeframe M1, M5, ... "- pressing will show the value of the indicators on this timeframe.
- "Value Trend direction". The values of the indicators that make up the trend direction from the previously chosen timeframe. (the default is the current timeframe)
- "Support & Resistance".
- "Horizontal line" Building horizontal levels (fractals and RSI)
- "Trend line" Building support and resistance trend lines (RSI)
- "SUP" support
- "RES" resistance
- "Chanel" Channeling
- "SUP" support
- "RES" resistance
- "Fibonacci control"
- "Сhange Fibonacci" choice of the option of calculating the Fibonacci levels for sale and purchase for 6 different calculations (Best, Standard, debt of flow, Impulse, Zig_Zag, RSI)
- "Auto" by calculated trend
- "Flat" buy and sell
- "Up" only buy
- "Down" only sell
- View the algorithms (Change Fibonacci) of other variants:
- |< first
- < previous
- > next
- >| last
- "Alert signal ". Current trading signals
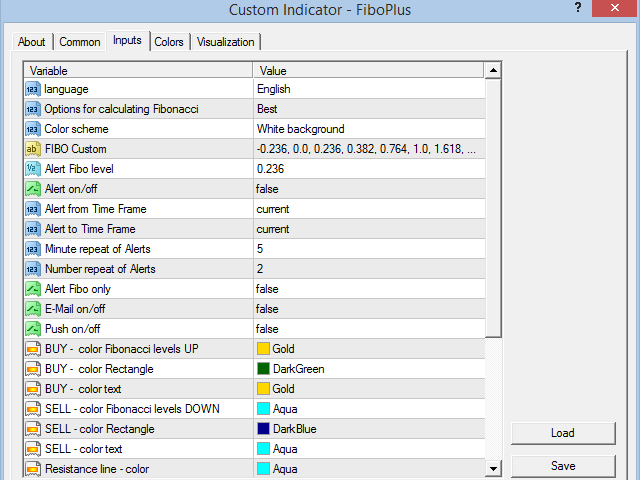
Parameters
- Language (Russian, English, Deutsch, Espanol, Portugues)
- Fibo level options:
- Best - use same-color candles till the candle of an opposite color appears
- Standard - standard application
- debt of flow - dept flow of the Market Maker, obtained during the activation of strong market distortions
- Impulse based on the indicator Awesome Oscillator
- Zig_Zag based on the indicator Zig_Zag
- RSI based on the indicator Relative Strength Index
- Color scheme - Сolor scheme (preset colors):
- White background - for white background
- Black background - for black background
- Custom background - custom settings of all colors
- FIBO Custom (level values separated by «,»)
- User Fibo level Alert - Fibonacci user level for alerts
- Alert on/off - Alerts (enable/disable)
- Alert from Time Frame, Alert to Time Frame - Timeframes for alerts
- Minute repeat of Alerts - Repeat alerts in a specific number of minutes
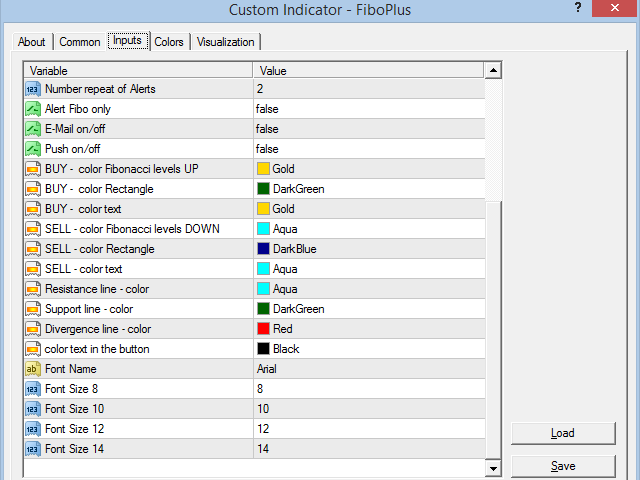
- Number repeat of Alerts - The number of alert repetitions
- Alert Fibo only - Alerts only by Fibonacci retracement
- E-Mail on/off - Send alerts to E-Mail
- Push on/off - Send alerts via Push notifications
- custom color settings:
- BUY - color Fibonacci levels UP, BUY - color of Rectangle, BUY - text color
- SELL - color Fibonacci levels DOWN, SELL - color Rectangle, SELL - color text,
- Resistance line - color, Support line - color,
- Divergence line - color, color text in the button
- Setting and font size
- Font Name - font name
- Font Size 8, 10, 12, 14 - font size
FiboPlus based trading system
- Sell. Candle closes below level 100, stop loss exceeds 76.4, take profit minimum 161.8, take profit 1 - 261.8, take profit 2 - 423.6.
- Buy. Candle closes above level 100, stop loss is below level 76.4, take profit minimum 161.8, take profit 1 - 261.8, take profit 2 - 423.6.
- Buy/Sell in a rectangle area limited by level 0-100. Trading is performed from one level to another (no trend).
- Earlier entry into the market. Log on to the next candle, after the formation of a new Fibonacci retracement stop loss -23.6 (minus 23.6) or beyond the horizontal level.
- The "debt of flow" option. FiboPlus plots the "debt of flow" levels of the Market Maker, the price has a high probability to return to these levels.
Trading from the level 100 to take profit 1 - 50, take profit 2 - 33. The second option is to place limit orders at the levels of 50% and 33% following the trend.
I recommend that you update the data before applying the indicator to the current chart (by subsequently clicking M1, M5, M15, M30, H1, D1, W1, MN periods).


Renting for a month to see how I like it.