Mean Reversion Supply Demand MT5
- Indicatori
-
Young Ho Seo
 Harmonic Pattern Indicator - Repainting + Japanese Candlestick Pattern Scanner + Automatic Channel + Many more
https://www.mql5.com/en/market/product/4488 - Versione: 5.8
- Aggiornato: 5 novembre 2020
- Attivazioni: 5
Mean Reversion Supply Demand Indicator
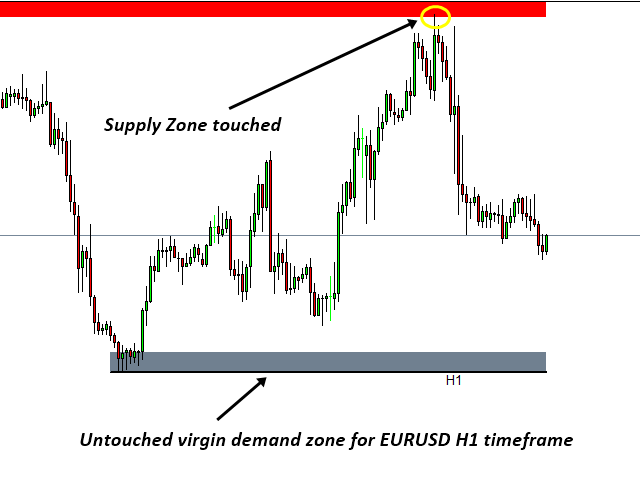
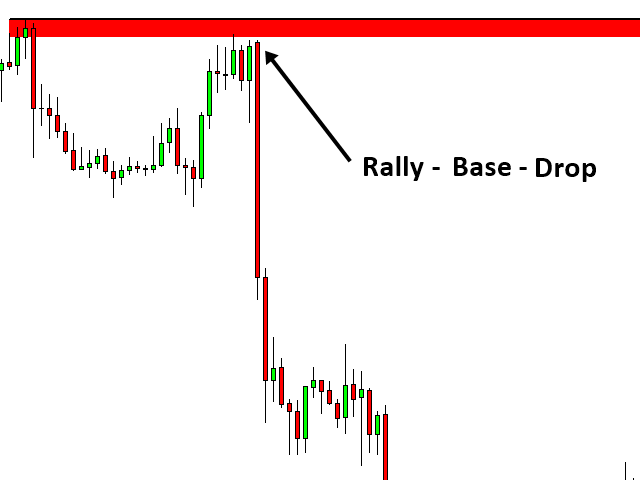
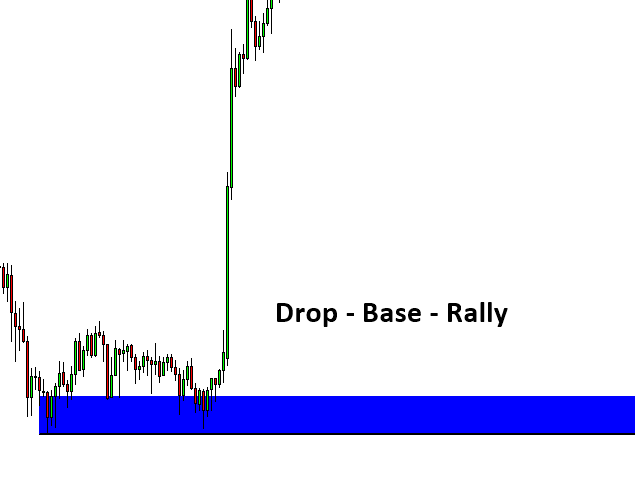
Mean Reversion Supply Demand is the indicator to detect the important supply demand zone in your chart. The concept of supply demand trading relies on the quantity mismatching between buying and selling volumes in the financial market. Typically, supply demand zone serves to predict the turning point. The wave pattern, for any supply demand zone to work as an successful trade, looks like the price must touch the base zone, move away and then return to zone again. At this point, our trade will be placed and the price need to move away from the zone again to profit. For the successful supply demand trading, zigzag movement of the price is essential. This type of zigzag movement is also the typical mean reversion or fractal wave characteristic.
Features of Mean Reversion Supply Demand
- Automatic profit target and stop loss detection for any supply demand zone
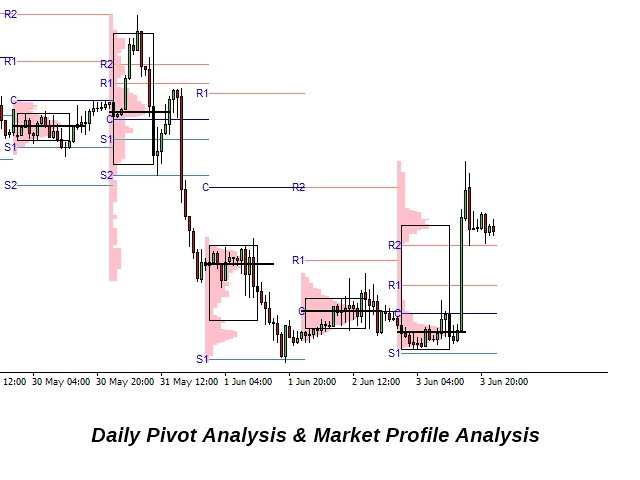
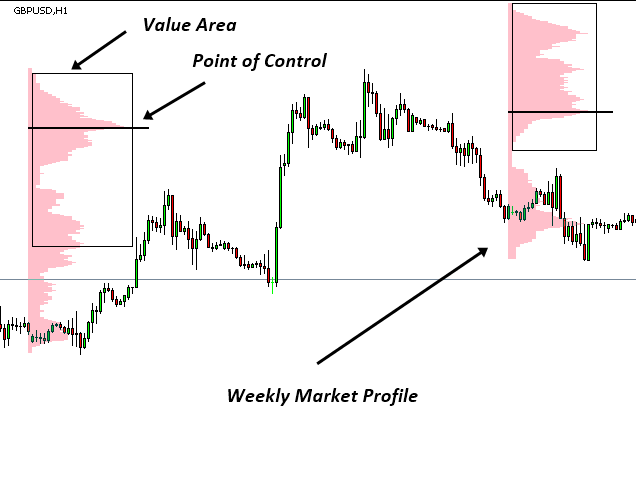
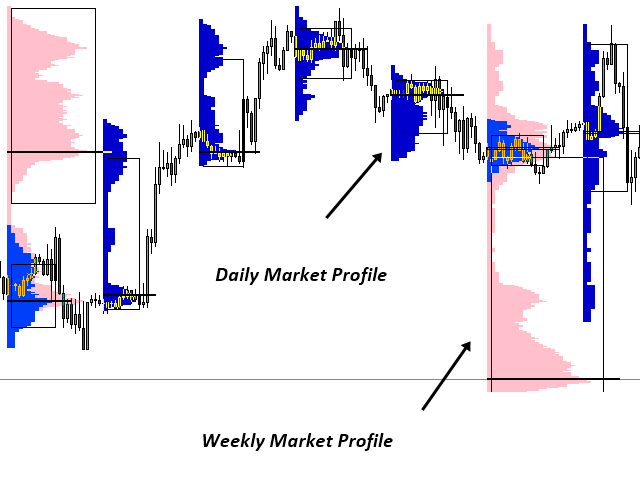
- Daily, Weekly and Monthly Market Profile Analysis to further gauge the mean reversion characteristics of market (Value area and point of control calculation included.)
- Daily, Weekly, Monthly Pivot Analysis to improve your mean reversion analysis
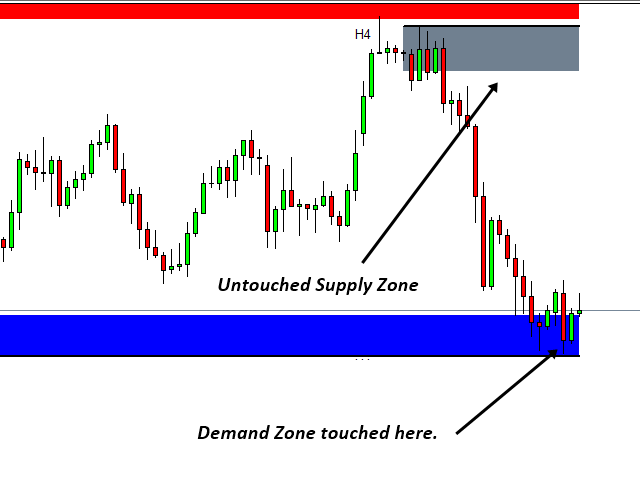
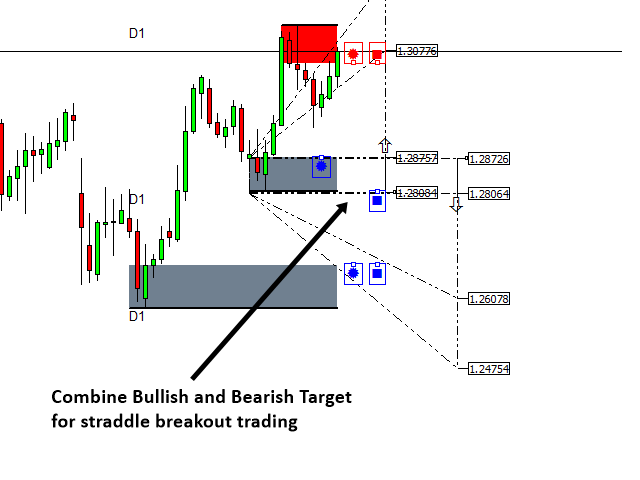
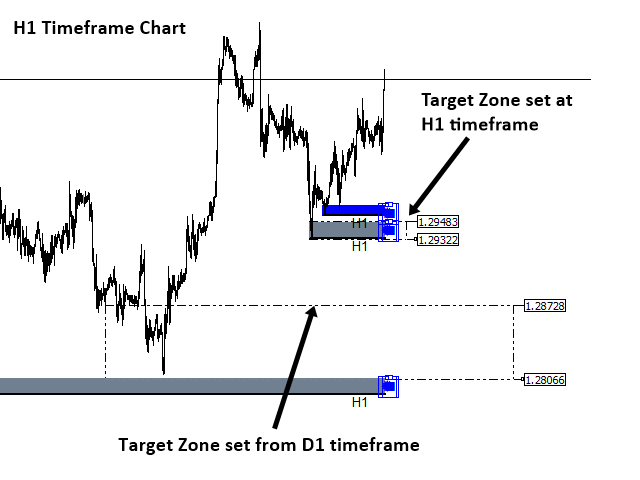
- Capability to do multiple time frame analysis on the same chart. (Simultaneous use of hourly, 4 hourly and daily supply demand zones are possible.)
- Automatic Retouch detection of each supply demand zone. (Easy to identify which zone is virgin and which are not.)
- Sound, Email, Push notification is possible when any supply demand zone is touched or for selected zone only (Recommended mode).
How to use Mean Reversion Supply Demand
Our tool offer daily, weekly and monthly Market Profile to gauge the odds of the mean reversion for the market. To construct the market profile, the timeframe for chart must be carefully chosen for the proper calculation of Market Profile. Normally it is important to recognize the price movement outside the value area. Daily market profile might offer you short term mean reversion opportunity comparing to weekly and monthly.
- Daily Market Profile: M5 to H1 timeframe can be used. M30 is recommended.
- Weekly Market Profile: M30 to H4 timeframe can be used. H1 is recommended.
- Monthly Market Profile: H1 to D1 timeframe can be used. H4 is recommended.
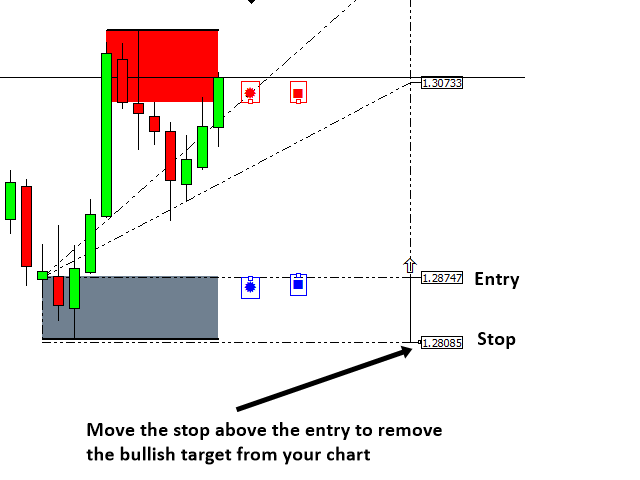
Beside the market profile analysis, you can also add daily, weekly and monthly Pivot Analysis to improve your accuracy. To detect valid supply demand zone, we recommend to use two or three timeframe at the same time in one chart to detect valid zone. For one example, you can open hourly chart and you can apply our Mean Reversion Supply Demand to detect hourly and 4 hourly supply demand zone in the same chart. Supply and demand zone confirmed in multiple timeframe normally offer better odds for your trading. When you have found the good supply demand zone for trading, click on Box of the Supply or Demand zone to see your trading setup including target profit, stop loss level (Fully automatic).
Trading Strategy Guide
The good trading strategy guide for the supply demand trading can be fround from Technical Analysis in Forex and Stock Market (Supply Demand Analysis and Support Resistance, 2021). In addition, you can also use the book: Science Of Support, Resistance, Fibonacci Analysis, Harmonic Pattern, Elliott Wave and X3 Chart Pattern (In Forex and Stock Market Trading, 2021) to find out the explanation for support and resistance as well as other advanced technical anaysis. Please visit the link below for more details about the trading strategy guide with supply demand zone trading.
Supply Demand Zone Trading Guide: https://www.mql5.com/en/blogs/post/750386
Inputs
- Use supply demand zone: use this to switch on and off supply demand zone detection.
- Timeframe for Calculation: Set this to timeframe for multiple time frame analysis
- Strength at Origin: 0 to 10 only
- Bars to Scan: amount bars for computation for supply demand calculation
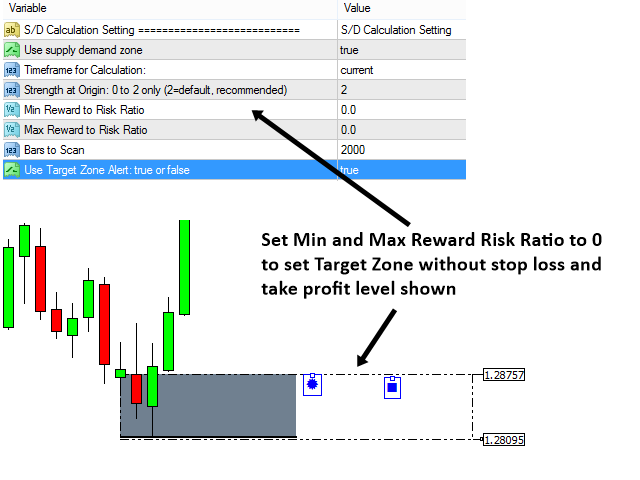
- Max Reward to Risk Ratio: Your preferred maximum reward/risk
- Min Reward to Risk Ratio: Your preferred minimum reward/risk
Important Note
This is the off the shelf product. Therefore, we do not accept any modification or customization request on this product. In addition, we do not provide any code library or any support for your coding for this product.

I would like to put a great review for Mr. Young and his work, but I just cant do this for this indicator. I have had it over two years and it just does not do well with the Forex pairs that I trade. I realize Mr. Young puts a lot of thought into what he reads and designs, but Supply/Demand, support resistance, harmonics and trends do not work on assets that are manipulated by the Brokers. In other words, this indicator may work well on assets that are in harmony with technical analysis, but when man interferes with TA, it does not work as it should. It is very possible this indicator would work better on Stocks and Futures, but with Forex having no centralized pricing, it does not do well on them. At least for me and what I trade. -------------------
Many of his indicators ask you to add additional indicators in order to help support the one, but nobody can do this when the additional run 98, 100, 100 and 200 dollars a pop. I have had two years to master this indicator.
He says; "Additionally, you can use following products to yield excellent trading performance, too. However, adding these tools are optional. You must do so only after you are familiar with Precision Support Resistance tool.
Harmonic Pattern Plus MT5
Harmonic Pattern Scenario Planner MT5
Price breakout Pattern Scanner MT5
Sideways Market Statistical Analyzer MT5