Triple Channel MT5

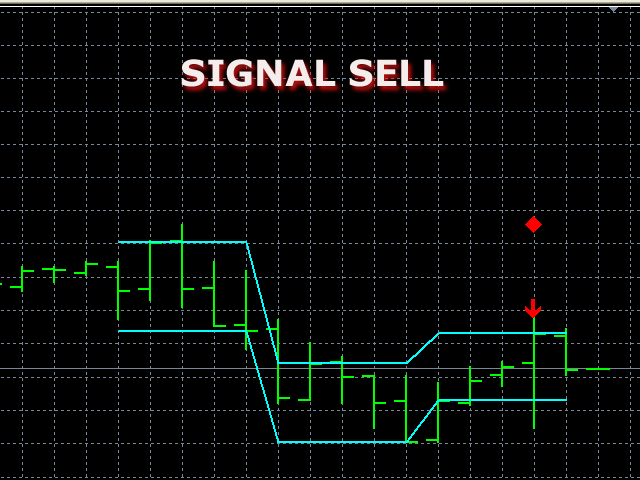
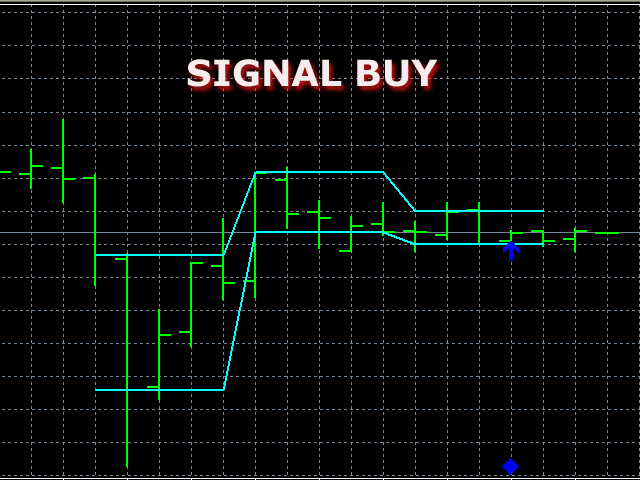
The indicator plots three consecutive channels by Close prices and checks if they match the scheme shown in the screenshots. The length of each channel is not fixed and is selected by the program within the range ChMin and ChMax. When the match is found, a signal is formed (an appropriately colored arrow). A possible stop loss level is displayed as a diamond. A signal may be accompanied by a pop-up window, a push notification and/or an email. The indicator works by Open prices.


Parameters

  • ChMin - minimum channel length;
  • ChMax - maximum channel length;
  • signalLive - signal lifetime (repeated signal fixing interval);
  • UseAlert - allow a pop-up window;
  • UsePush - allow a push notification;
  • UseEmail - allow an email alert.
Produits recommandés
K Channel
Pavel Gotkevitch
K_Channel is a technical indicator defining the current Forex market status - trend or flat. The indicator works on any timeframe. H1 and higher timeframes are recommended though to minimize false signals. The indicator is displayed as lines above and below EMA. Average True Range (ATR) is used as bands' width. Therefore, the channel is based on volatility. This version allows you to change all the parameters of the main Moving Average. Unlike Bollinger Bands that applies the standard deviation
The indicator detects divergence signals - the divergences between the price peaks and the MACD oscillator values. The signals are displayed as arrows in the additional window and are maintained by the messages in a pop-up window, e-mails and push-notifications. The conditions which formed the signal are displayed by lines on the chart and in the indicator window. The indicator parameters MacdFast - fast MACD line period MacdSlow - slow MACD line period MacdSignal - MACD signal line period Macd
Fractals
Mikhail Nazarenko
The Fractals indicator displays on the chart only fractals with the specified parameters in the indicator settings. This allows you to more accurately record a trend reversal, excluding false reversals. According to the classical definition of a fractal, it is a candlestick - an extremum on the chart, which was not crossed by the price of 2 candles before and 2 candles after the appearance of a fractal candle. This indicator provides the ability to adjust the number of candles before and after t
"Advanced Daily VWAP with Standard Deviation and Trading Bands" Description: "The 'Advanced Daily VWAP with Standard Deviation and Trading Bands' indicator offers a comprehensive view for traders who wish to make the Volume Weighted Average Price (VWAP) the crux of their trading strategy. It not only calculates the VWAP on a daily basis but also incorporates standard deviation to give an accurate representation of market volatility. The trading bands are calculated using a 1.5% multiplier for th
LBR Oscillator
Pablo Filipe Soares De Almeida
LBR Oscillator – 3/10 Oscillator Le LBR Oscillator est une version améliorée du classique 3/10 Oscillator, largement utilisé et popularisé par la trader professionnelle Linda Raschke. Cet indicateur a été développé en suivant la configuration standard originale utilisée par Linda Raschke, avec des moyennes mobiles de 3 et 10 périodes et une ligne de signal de 16 périodes, axé sur la lecture du momentum et des changements de rythme du marché. Base conceptuelle – Comment Linda Raschke utilise le 3
Swing Tracer
Ely Alsedy
5 (1)
it depends on ATR period to get swing points to help make better trading decisions  blue dot and red dot is the default color scheme of course you can change it later if you'd like  you can change the following : ATR PERIOD  sending notifications number of times to send notifications  sending notifications to your smart phone that's it very simple to use just drag and drop and follow the trend 
Renko System
Marco Montemari
This indicator can be considered as a trading system. It offers a different view to see the currency pair: full timeless indicator, can be used for manual trading or for automatized trading with some expert advisor. When the price reaches a threshold a new block is created according to the set mode. The indicator beside the Renko bars, shows also 3 moving averages. Features renko mode median renko custom median renko 3 moving averages wicks datetime indicator for each block custom notification
The ADX indicator (average directional index) is a technical tool designed to measure the strength of a market trend. The ADX indicator is used for various purposes such as measuring the strength of a trend, finding a trend and a trading range, and as a filter for various Forex trading strategies. Some of the best trading strategies are based on following the market trend. There are also strategies through which traders make profit by trading against the trend. In any case, if you can identify
KDJ Index 4   交易实用必备工具指标 波浪自动计算指标,通道趋势交易 完美的趋势-波浪自动计算通道计算 , MT4版本 完美的趋势-波浪自动计算通道计算 , MT5版本 本地跟单复制交易 Easy And Fast Copy , MT4版本 Easy And Fast Copy , MT5版本 本地跟单复制交易 模拟试用 Easy And Fast Copy , MT4 模拟账号运行 Easy And Fast Copy , MT5 模拟账号运行 "Cooperative QQ:556024  "  "Cooperation wechat:556024"  "Cooperative email:556024@qq.com" 强烈推荐趋势指标, 波浪的标准自动计算   和   波浪的标准自动计算MT5版本     KDJ指标又叫 随机指标 ,是一种相当新颖、实用的技术分析指标,它起先用于期货市场的分析,后被广泛用于股市的中短期趋势分析,是期货和股票市场上最常用的技术分析工具。 随机指标KDJ一般是用于股票分析的统计体系,根据统计学原理,通过一个特定的周期(常为9日、9周等)
BeST_Keltner Channels Strategies MT5   is an  MT5  Indicator based on the original Keltner Channels Indicator and it can display in the Chart all the known Variations of Keltner Channels and also the corresponding 10 totally Strategies. Every such generally consists of a Central Moving Average Line and two Boundary Bands at a distance above and below it and can be traded mainly in a Trending Mode but also in a Ranging ReEntry Mode.  BeST_Keltner Channels Strategies Indicator Draws definite Buy
Fibonacci Moving Average by Quant Atlas Fibonacci Moving Average is a visual trend structure indicator built around a layered Fibonacci based moving average framework. The indicator plots two dynamic average lines directly on the price chart, creating a clean view of how price behaves relative to broader trend structure. The lines automatically change color depending on the position of price, making market direction easier to read at a glance. Visual Logic • Blue line state: price is trading abo
Linear Regressions Convergence Divergence is an oscillator indicator of a directional movement plotted as a difference of two linear regressions with lesser and greater periods. This is a further development of the ideas implemented in the standard MACD oscillator. It has a number of advantages due to the use of linear regressions instead of moving averages. The indicator is displayed in a separate window as a histogram. The signal line is a simple average of the histogram. The histogram value a
Legacy of Gann for MT5
Pavel Zamoshnikov
5 (5)
The indicator very accurately determines the levels of the possible end of the trend and profit fixing. The method of determining levels is based on the ideas of W.D.Gann, using an algorithm developed by his follower Kirill Borovsky. Extremely high reliability of reaching levels (according to K. Borovsky  - 80-90%) Indispensable for any trading strategy – every trader needs to determine the exit point from the market! Precisely determines targets on any timeframes and any instruments (forex, met
Easy GOLD MT5
Franck Martin
3.91 (43)
Easy Gold is the latest addition to the BotGPT family. It is surprising and very powerful. It is ideal for beginners due to its simplicity.  There is absolutely nothing to do, it's 100% automated, simply indicate the percentage of risk you want to take per trade and the EA is ready. Whatever your capital, the EA takes care of everything. Optimized on (XAUUSD).  Unleash all the power with the professional version (AGI Gold) and its connection to the neural network, available in my store. My othe
FREE
Lomb Periodogram
Alfred Mirzasalikhov
The Lomb algorithm is designed to find the dominant cycle length in noisy data. It is used commonly in the field of astronomy and is very good at extracting cycle out of really noisy data sets. The Lomb phase plot is very similar to the Stochastics indicator. It has two threshold levels. When it crosses above the lower level it’s a buy signal. When it crosses the upper level it’s a sell signal. This is cycle-based indicator, the nicer waves look, the better the signal. Caution Also It’s really i
RangeZone  Indicator General Overview: Global Exchange Trading from East to West World financial markets operate on the principle of continuous trading sessions, where activity moves with the sun from one financial center to another. Understanding this dynamic is key to successful trading! How Trading Moves Around the World: Asian Session   (Sydney, Tokyo): Opens first, sets the tone for daily volatility Japanese yen, Australian dollar, Asian indices Often forms key support/resistance level
The Market Structure Analyzer is a powerful tool designed for traders who follow market structure and smart money concepts. This comprehensive indicator provides a suite of features to assist in identifying key market levels, potential entry points, and areas of liquidity. Here's what it offers: 1. Swing High/Low Detection : Accurately identifies and marks swing highs and lows, providing a clear view of market structure. 2. Dynamic Supply and Demand Zones: Draws precise supply and demand zone
Представлен принципиально новый индикатор ZigZag, который отличается от стандартного абсолютной легкостью, быстродействием расчетов и очень высокой точностью. В основе индикатора заложен принцип цикличности рынка с совокупностью анализа количества текущих баров и их основных ценовых уровней. Чем меньше баров для определения расчетов, тем более агрессивная постройка линий индикатора. Как и в  стандартном индикаторе перерисовывается только последняя линия, при изменении достигнутого экстремума. П
ZLMA Trend Candles indicator uses an enhanced Zero-Lag Moving Average to highlight key trend shifts, repainting candles in real time. It reacts faster than traditional moving averages, helping you spot potential market turns earlier. Gain clear entry and exit signals and filter out market noise with ease! This product is also available for MetaTrader 4 =>  https://www.mql5.com/en/market/product/129279 1. What Is ZLMA Trend Candles? ZLMA Trend Candles is a MetaTrader 4/5 indicator based on the Z
TrendDetect
Pavel Gotkevitch
The Trend Detect indicator combines the features of both trend indicators and oscillators. This indicator is a convenient tool for detecting short-term market cycles and identifying overbought and oversold levels. A long position can be opened when the indicator starts leaving the oversold area and breaks the zero level from below. A short position can be opened when the indicator starts leaving the overbought area and breaks the zero level from above. An opposite signal of the indicator can b
All about time and price by ICT. This indicator provides a comprehensive view of ICT killzones, Silver Bullet times, and ICT Macros, enhancing your trading experience.  In those time windows price either seeks liquidity or imbalances and you often find the most energetic price moves and turning points. Features: Automatic Adaptation: The ICT killzones intelligently adapt to the specific chart you are using. For Forex charts, it follows the ICT Forex times: In EST timezone: Session: Asia: 20h00-0
Gekko MACD Plus
Rodrigo Galeote
3 (3)
Type: Oscillator This is Gekko's Cutomized Moving Average Convergence/Divergence (MACD), a customized version of the famous MACD indicator. Use the regular MACD and take advantage of several entry signals calculations and different ways of being alerted whenever there is potential entry point. Inputs Fast MA Period: Period for the MACD's Fast Moving Average (default 12); Slow MA Period: Period for the MACD's Slow Moving Average (default 26); Signal Average Offset Period: Period for the Signal A
Donchian Channel DC is the indicator of Donchian Channels, that plots maximum and minimum values of a specific period, besides mean value line. It´s possible to configure simple period for analysis and the indicator will plot all three values. You can trade with this indicator as trend or reversal, according to each strategy. Do not let to test others indicators as soon as others expert advisors.
Liquidity Touch Zones PRO X - is   a support and resistance indicator that identifies   price areas of confirmed strength   formed by repeated price interactions and displayed taking into account the instrument's characteristic volatility. The calculation is based on fractal points, which serve as initial benchmarks. These points form price zones reflecting repeated price interactions and are represented as areas of varying heights depending on the level's significance. It is designed for trader
L'indicateur Forex RSI Double Stochastique est une modification de l'oscillateur stochastique pour la plateforme MetaTrader 5. INFORMATIONS SUR L'INDICATEUR L'indicateur forex Double Stochastique implémente un double stochastique appliqué au RSI, en utilisant des niveaux flottants au lieu de niveaux fixes pour évaluer la survente et la surachat. Dans les cas où la période RSI est <=1, vous obtenez juste une double stochastique. Vous pouvez utiliser un lissage supplémentaire des résultats (l
InfinX Slope MT5
Stanislav Shtiliyanov
The Slope indicator   measures the slope of a linear regression , which is the line of best fit for a data series. A 20-period Slope, therefore, measures the slope of a 20-day linear regression. ... In general, a positive slope indicates an uptrend, while a negative slope indicates a downtrend. How do you use slope Indicator? By applying the slope indicator  to both the price chart and the price relative , chartists can quantify the price trend and relative performance with one indicator. A pos
Présentation de l'indicateur : L'indicateur dessine une ligne de tendance et un histogramme, il a un petit décalage de prix et n'a pas de fonctions futures, les signaux ne dériveront pas. Lorsque le marché est soumis à des oscillations inter-zones, si l'indicateur apparaît en histogramme rouge et vert, il s'agit d'une zone de prix bas, si l'indicateur apparaît en magenta et histogramme jaune, il s'agit d'une zone de prix élevés. Il peut également être utilisé pour analyser la tendance du march
FREE
Smoothed Heiken Ashi Plus
Daniel Ortega Clemente
5 (1)
Overview: This technical indicator applies a double smoothing algorithm to the standard Heiken Ashi calculation. It is designed to filter market noise and visualize the market structure clearly without the lag associated with standard moving averages. The tool allows the user to select different Moving Average types, including Hull Moving Average (HMA) and Linear Weighted Moving Average (LWMA) , to calculate the open, high, low, and close prices of the candles. Key Features: Double Smoothing En
FREE
DS Candle Percent Panel
Herminio Jesus Da Costa Machado
DS Candle Percent Panel – A complete market overview at a glance The DS Candle Percent Panel is an advanced indicator that displays in real time the percentage change of price relative to the opening of each candle across multiple timeframes — from M1 to D1 , including custom periods like H2 and H6 . With this tool, you no longer need to switch between multiple charts to see whether the market is rising on H1 while falling on M1. Everything is shown clearly, coherently, and instantly in a com
Point Directions MT5 - Un indicateur montrant les niveaux ponctuels de support et de résistance lorsque le prix bouge. Les flèches indiquent les rebonds de prix dans les directions indiquées. Les flèches ne sont pas redessinées, elles se forment sur la bougie courante. Fonctionne sur tous les délais et instruments de trading. Il existe plusieurs types d'alertes. Possède des paramètres avancés pour personnaliser les signaux de n'importe quel graphique. Peut être configuré pour négocier avec la t
Les acheteurs de ce produit ont également acheté
Neuro Poseidon MT5
Daria Rezueva
4.98 (42)
Neuro Poseidon is a new indicator by Daria Rezueva. It combines precise trading signals with adaptive TP/SL levels - creating best possible trades as a result! Message me and get  Neuro Poseidon Assistant  as a gift to automize your trading process! What makes it stand out? 1. Proven profitability on all assets and timeframes 2. Only confirmed BUY and SELL signals present on the chart 3. Adaptive TP & SL levels generated by the software for each trade 4. Easy to understand - suitable for al
SuperScalp Pro
Van Minh Nguyen
4.67 (27)
SuperScalp Pro – Système avancé d’indicateur de scalping multi-filtres SuperScalp Pro est un indicateur de scalping avancé qui combine le Supertrend classique avec plusieurs filtres de confirmation intelligents afin d’identifier les opportunités de trading. Il fonctionne efficacement sur plusieurs unités de temps, de M1 à H4, avec des performances optimisées sur XAUUSD, BTCUSD et les principales paires Forex. L’indicateur fournit des signaux d’achat et de vente clairs, ainsi que des niveaux d’en
Commençons par être honnêtes. Aucun indicateur ne vous rendra rentable à lui seul. Si quelqu’un vous dit le contraire, il vous vend un rêve. Tout indicateur qui affiche des flèches parfaites d’achat/vente peut être rendu impeccable — il suffit de zoomer sur la bonne partie de l’historique et de capturer uniquement les trades gagnants. Nous ne faisons pas cela.  SMC Intraday Formula est un outil. Il lit la structure du marché pour vous, identifie les zones de prix à la probabilité la plus élevée
Ce produit a été mis à jour pour le marché 2026 et optimisé pour les dernières versions de MT5. AVIS DE MISE À JOUR DU PRIX : Smart Trend Trading System est actuellement disponible à $99 . Le prix passera à $199 après les 30 prochains achats . OFFRE SPÉCIALE : Après avoir acheté Smart Trend Trading System, envoyez-moi un message privé pour recevoir Smart Universal EA GRATUITEMENT et transformer vos signaux Smart Trend en trades automatisés. Smart Trend Trading System est un système de trading c
Entry In The Zone and SMC Multi Timeframe is a real-time 2-in-1 market analysis tool that combines market structure analysis and a No Repaint BUY / SELL signal system into a single indicator, built on Smart Money Concepts (SMC) — a widely adopted framework used by professional traders to understand market structure. This indicator helps you see the market more clearly, make decisions based on structure rather than guesswork, and focus on high-probability zones where price is more likely to react
Trend Catcher ind mt5
Ramil Minniakhmetov
5 (6)
INDICATEUR DE DÉTECTEUR DE TENDANCE L'indicateur de détecteur de tendance analyse les mouvements de prix du marché grâce à une combinaison d'indicateurs d'analyse de tendance adaptatifs, propriétaires et personnalisés. Il identifie la véritable direction du marché en filtrant les fluctuations à court terme et en se concentrant sur la force de la dynamique sous-jacente, l'expansion de la volatilité et la structure des prix. Il utilise également une combinaison d'indicateurs personnalisés de lis
Quantum TrendPulse
Bogdan Ion Puscasu
5 (25)
Présentation de   Quantum TrendPulse   , l'outil de trading ultime qui combine la puissance de   SuperTrend   ,   RSI   et   Stochastic   dans un seul indicateur complet pour maximiser votre potentiel de trading. Conçu pour les traders qui recherchent précision et efficacité, cet indicateur vous aide à identifier les tendances du marché, les changements de dynamique et les points d'entrée et de sortie optimaux en toute confiance. Caractéristiques principales : Intégration SuperTrend :   suivez f
Divergence Bomber
Ihor Otkydach
4.9 (90)
Chaque acheteur de cet indicateur reçoit également gratuitement : L’outil exclusif « Bomber Utility », qui accompagne automatiquement chaque opération de trading, fixe les niveaux de Stop Loss et de Take Profit, et clôture les positions selon les règles de la stratégie Des fichiers de configuration (set files) pour adapter l’indicateur à différents actifs Des set files pour configurer le Bomber Utility selon différents modes : « Risque Minimum », « Risque Équilibré » et « Stratégie d’Attente » U
PrimeScalping
Temirlan Kdyrkhan
PrimeScalping is a powerful trading companion designed to generate high-probability entry signals with dynamic TP/SL/DP levels based on volatility. Built-in performance tracking shows win/loss stats, PP1/PP2 hits, and success rates — all updated live. Key Features: Buy/Sell signals with adaptive volatility bands Real-time TP/SL/DP levels based on ATR Built-in MA Filter with optional ATR/StdDev volatility Performance stats panel (Success, Profit/Loss, PP1/PP2) Alerts via popup, sound, push, or e
Power Candles MT5
Daniel Stein
5 (8)
Power Candles V3 - Indicateur de force à optimisation automatique Power Candles V3 transforme la force des devises et des instruments en un plan de trading exploitable sur chaque graphique auquel il est associé. Au lieu de se contenter de colorer les bougies, il effectue une optimisation automatique en temps réel en arrière-plan et vous fournit les meilleurs niveaux de Stop Loss, Take Profit et seuils de signal pour le symbole que vous avez sous les yeux. Un simple clic suffit pour l'adopter en
FX Trend MT5 NG
Daniel Stein
5 (6)
FX Trend NG : La Nouvelle Génération d’Intelligence de Tendance Multi-Marchés Vue d’ensemble FX Trend NG est un outil professionnel d’analyse de tendance multi-timeframe et de surveillance des marchés. Il vous permet de comprendre la structure complète du marché en quelques secondes. Au lieu de naviguer entre de nombreux graphiques, vous identifiez immédiatement quels instruments sont en tendance, où le momentum s’affaiblit et où plusieurs unités de temps sont alignées. Offre de Lancement – Ob
Gann Made Easy   est un système de trading Forex professionnel et facile à utiliser qui est basé sur les meilleurs principes de trading en utilisant la théorie de mr. WD Gann. L'indicateur fournit des signaux d'ACHAT et de VENTE précis, y compris les niveaux Stop Loss et Take Profit. Vous pouvez échanger même en déplacement en utilisant les notifications PUSH. VEUILLEZ ME CONTACTER APRÈS L'ACHAT POUR RECEVOIR GRATUITEMENT DES INSTRUCTIONS DE TRADING ET D'EXCELLENTS INDICATEURS SUPPLÉMENTAIRES! V
Atomic Analyst MT5
Issam Kassas
4.26 (35)
Ce produit a été mis à jour pour le marché 2026 et optimisé pour les dernières versions de MT5. AVIS DE MISE À JOUR DU PRIX : Atomic Analyst est actuellement disponible à $99 . Le prix passera à $199 après les 30 prochains achats . OFFRE SPÉCIALE : Après avoir acheté Atomic Analyst, envoyez-moi un message privé pour recevoir Smart Universal EA GRATUITEMENT et transformer vos signaux Atomic Analyst en trades automatisés. Atomic Analyst est un indicateur de trading Price Action sans repaint, san
M1 Quantum MT5
Hamed Dehgani
5 (3)
Note du développeur : Il ne reste qu' une seule licence au prix de 129 $ . Après sa vente, le prix passera à 149 $ . M1 Quantum est un système de trading professionnel pour M1 qui fournit des signaux rapides et précis avec Stop Loss, Take Profit et une gestion intelligente du capital intégrés. M1 Quantum contient un système professionnel de gestion du capital conçu pour faire croître le compte rapidement en se concentrant sur les gains consécutifs . Fonctionnalités principales de l' indicateur
Ce produit a été mis à jour pour le marché 2026 et optimisé pour les dernières versions de MT5. AVIS DE MISE À JOUR DU PRIX : Smart Price Action Concepts est actuellement disponible à $200 . Le prix passera à $299 après les 30 prochains achats . OFFRE SPÉCIALE : Après l’achat, envoyez-moi un message privé pour recevoir un bonus gratuit + un cadeau . Tout d’abord, il est important de souligner que cet outil de trading est un indicateur sans repaint, sans redrawing et sans retard, ce qui le rend
Market Structure Order Block Dashboard MT5 est un indicateur MT5 conçu pour les traders qui veulent lire la structure de marché et les principales zones de réaction du prix directement sur le graphique. Il combine BOS, ChoCH, Order Blocks, Fair Value Gaps (FVG), Liquidité, Kill Zones, Volume Profile, et un dashboard compact pour une analyse rapide. Cet indicateur s'adresse aux traders qui utilisent la structure de marché, les concepts ICT et Smart Money comme cadre de décision. Il peut aider à r
ARIPoint
Temirlan Kdyrkhan
1 (1)
ARIPoint is a powerful trading companion designed to generate high-probability entry signals with dynamic TP/SL/DP levels based on volatility. Built-in performance tracking shows win/loss stats, PP1/PP2 hits, and success rates all updated live. Key Features: Buy/Sell signals with adaptive volatility bands Real-time TP/SL/DP levels based on ATR Built-in MA Filter with optional ATR/StdDev volatility Performance stats panel (Success, Profit/Loss, PP1/PP2) Alerts via popup, sound, push, or email Cu
GoldenX Entry MT5
Kareem Abbas
5 (12)
GoldenX Entry est un indicateur MT5 doté d’un algorithme adaptatif Smart Entry Trend, d’un système de scoring des signaux, d’un détecteur de régime de marché et d’un filtre de volatilité. Chaque signal inclut un niveau d’entrée calculé, trois niveaux de Take-Profit (TP1, TP2, TP3) ainsi qu’un niveau de Stop-Loss. Il est construit sur plusieurs couches analytiques conçues pour s’adapter à différentes conditions de marché, combinant un système analytique multicouche avec un optimiseur intégré et u
Azimuth Pro
Ottaviano De Cicco
5 (7)
Azimuth Pro V2: Synthetic Fractal Structure and Confirmed Entries for MT5 Overview Azimuth Pro is a multi-level swing structure indicator by Merkava Labs . Four nested swing layers, swing-anchored VWAP, ABC pattern detection, three-timeframe structural filtering, and closed-bar confirmed entries — one chart, one workflow from micro-swings to macro-cycles. This is not a blind signal product. It is a structure-first workflow for traders who care about location, context, and timing. V2 Launch Offe
Gem SIGNAL
Shengzu Zhong
5 (1)
GEM Signal Pro GEM Signal Pro est un indicateur de suivi de tendance pour MetaTrader 5, conçu pour les traders qui souhaitent des signaux plus clairs, des configurations de trade plus structurées et une gestion du risque plus pratique directement sur le graphique. Au lieu d’afficher simplement une flèche, GEM Signal Pro aide à présenter l’idée complète du trade de manière plus claire et plus lisible. Lorsque les conditions sont confirmées, l’indicateur peut afficher le prix d’entrée, le stop los
Crystal Heikin Ashi Signals
Muhammad Jawad Shabir
5 (2)
Crystal Heikin Ashi Signals - Professional Trend & Signal Detection Indicator Advanced Heikin Ashi Visualization with Intelligent Signal System for Manual & Automated Trading Final Price: $149 ---------> Price goes up $10 after every 10 sales . Limited slots available — act fast . Overview Crystal Heikin Ashi Signals is a professional-grade MetaTrader 5 indicator that combines pure Heikin Ashi candle visualization with an advanced momentum-shift detection system. Designed for both manual traders
Reversion King Indicator
Eugen-alexandru Zibileanu
5 (4)
Un nouveau Roi en ville - Indicateur + Gestion des ordres (TP1 + TP2 + TP3) + Envoi optionnel de signaux Telegram INCLUS (GRATUIT) (SYSTÈME COMPLET DE TRADING et DE SIGNAUX) Notre meilleur EA pour l’Or : Gold Slayer Cet indicateur inclut une stratégie avancée, un système de trading avec gestion des ordres personnalisable ainsi qu’un système de retour à la moyenne combinant des extensions d’enveloppes, soutenu par plusieurs filtres intelligents de confirmation comme le RSI afin de détecter des en
KURAMA GOLD SIGNAL PRO (MT5) — Filtre à 7 couches · TP/SL automatique · Score de qualité · Sauvegarde de l'historique des signaux | Système de trading complet pour le XAUUSD Pas de repeint en temps réel. À l'instant où un signal apparaît, la flèche, l'entrée, le TP et le SL sont verrouillés sur place et ne bougent plus jamais ensuite. Ce que vous tradez, c'est ce signal en temps réel. Et dans la v7.20, chaque signal réellement envoyé est sauvegardé automatiquement et restauré à l'identique aprè
Quant Direction MT5
Georgios Kalomoiropoulos
Quant Direction est un outil d'analyse de marché 3D. Il fournit une analyse de marché parfaitement objective, basée sur un algorithme, en calculant des écarts précis en pourcentage sur différents paramètres. Développé à l'aide d'outils de modélisation avancés basés sur l'IA et soumis à des tests rigoureux, cet algorithme analyse le marché avec une précision inégalée. Vous pouvez analyser n'importe quelle paire de devises ou instrument financier sur la plateforme. Que vous pratiquiez le trading à
Grabber System MT5
Ihor Otkydach
4.83 (24)
Je vous présente un excellent indicateur technique : Grabber, qui fonctionne comme une stratégie de trading "tout-en-un", prête à l'emploi. En un seul code sont intégrés des outils puissants d'analyse technique du marché, des signaux de trading (flèches), des fonctions d'alerte et des notifications push. Chaque acheteur de cet indicateur reçoit également gratuitement : L'utilitaire Grabber : pour la gestion automatique des ordres ouverts Un guide vidéo étape par étape : pour apprendre à installe
Présentation       Quantum Breakout PRO   , l'indicateur révolutionnaire MQL5 qui transforme la façon dont vous négociez les zones d'évasion ! Développé par une équipe de traders expérimentés avec une expérience commerciale de plus de 13 ans,       Évasion quantique PRO       est conçu pour propulser votre parcours commercial vers de nouveaux sommets grâce à sa stratégie de zone de discussion innovante et dynamique. Quantum Breakout Indicator vous donnera des flèches de signalisation sur les z
SmartScalping
Temirlan Kdyrkhan
SmartScalping is a powerful trading companion designed to generate high-probability entry signals with dynamic TP/SL/DP levels based on volatility. Built-in performance tracking shows win/loss stats, PP1/PP2 hits, and success rates — all updated live. Key Features: Buy/Sell signals with adaptive volatility bands Real-time TP/SL/DP levels based on ATR Built-in MA Filter with optional ATR/StdDev volatility Performance stats panel (Success, Profit/Loss, PP1/PP2) Alerts via popup, sound, push, or e
RelicusRoad Pro MT5
Relicus LLC
4.96 (24)
RelicusRoad Pro : Système d'Exploitation Quantitatif du Marché 70% DE RÉDUCTION ACCÈS À VIE (DURÉE LIMITÉE) - REJOIGNEZ 2 000+ TRADERS Pourquoi la plupart des traders échouent-ils même avec des indicateurs "parfaits" ? Parce qu'ils tradent des concepts isolés dans le vide. Un signal sans contexte est un pari. Pour gagner, il faut de la CONFLUENCE . RelicusRoad Pro est un Écosystème Quantitatif complet . Il cartographie la "Fair Value Road", distinguant le bruit des cassures structurelles. Arrête
Smart Stop Indicator – Précision intelligente du stop-loss directement sur votre graphique Présentation Smart Stop Indicator est la solution idéale pour les traders qui souhaitent placer leur stop-loss de manière claire et méthodique, sans deviner ni suivre leur intuition. Cet outil combine la logique classique de price action (succession de plus hauts et de plus bas) avec une reconnaissance moderne des cassures pour identifier le prochain niveau de stop réellement logique. Que le marché soit
ScalpPoint
Temirlan Kdyrkhan
ScalpPoint is a powerful trading companion designed to generate high-probability entry signals with dynamic TP/SL/DP levels based on volatility. Built-in performance tracking shows win/loss stats, PP1/PP2 hits, and success rates — all updated live. Key Features: Buy/Sell signals with adaptive volatility bands Real-time TP/SL/DP levels based on ATR Built-in MA Filter with optional ATR/StdDev volatility Performance stats panel (Success, Profit/Loss, PP1/PP2) Alerts via popup, sound, push, or emai
Plus de l'auteur
UniversalEA
Sergey Deev
3.4 (5)
The Expert Advisor allows you to build a trading system based on a custom indicator. It performs automated opening/closing of deals based on the signals of an indicator that places values ​​other than 0 and EMPTY_VALUE in the buffer. The EA polls the values ​​of the specified indicator buffers, opens/closes and accompanies trades according to the specified parameters. The Expert Advisor implements the following trade support functions: - installation for the transaction SL and TP; - calculation
UniversalEaMT5
Sergey Deev
4 (1)
The Expert Advisor allows you to build a trading system based on a custom indicator. It performs automated opening/closing of trades based on the signals of arrow indicators (which buffer values ​​other than 0 and EMPTY_VALUE) or color lines. The EA polls the values ​​of the specified indicator buffers, opens/closes and accompanies trades according to the specified parameters. The Expert Advisor implements the following trade support functions: -installation of SL and TP; -calculation of the
EA Locking Grid
Sergey Deev
5 (1)
Semiautomatic EA for trading based on the averaging and locking strategy. The trader sends signals for opening grids by using the buttons on the chart. The EA opens a market order, places a grid of limit orders in the same direction with lot multiplication according to specified parameters and a locking stop order in the opposite direction with the volume equal to the sum of all the previous ones. Once the price passes the specified breakeven level, the EA places a stop loss at the open price+sp
The indicator displays the data of the Stochastic oscillator from a higher timeframe on the chart. The main and signal lines are displayed in a separate window. The stepped response is not smoothed. The indicator is useful for practicing "manual" forex trading strategies, which use the data from several screens with different timeframes of a single symbol. The indicator uses the settings that are identical to the standard ones, and a drop-down list for selecting the timeframe. Indicator Paramet
The indicator displays the data of the candles from a higher timeframe on the chart. Only the candle body (by the open and close prices) is displayed. The candlesticks are colored depending on the difference between the open and close prices. After removing the indicator from the chart, the objects used by it are deleted automatically. Indicator Parameters TimeFrame - time frame (drop-down list) BearColor - bearish candle color (standard dialog) BullColor - bullish candle color (standard dialog
The indicator displays the data of a standard MACD indicator from a higher timeframe. The product features notifications of crossing the zero or signal line by the histogram. Parameters TimeFrame - indicator timeframe (dropdown list) MacdFast - fast line period MacdSlow - slow line period MacdSignal - signal line period MacdPrice - price type (dropdown list) AlertCrossZero - enable notifications of crossing the zero line AlertCrossSignal - enable notifications of crossing the signal line UseNot
The indicator displays the moving average of a higher timeframe on the chart. The indicator parameters TimeFrame - time frame of the moving average (drop-down list) MaPeriod - moving average period MaMethod - moving average method (drop-down list) MaShift - moving average shift MaPrice - moving average price (drop-down list)
The indicator displays the data of the Average True Range (ATR) from a higher timeframe on the chart. It allows you to see the scope of the movement without having to switch to another screen terminal The indicator parameters TimeFrame - time frame of the data (drop-down list) can not be lower than current AtrPeriod - period of the Average True Range indicator a higher timeframe range
MTF ADX
Sergey Deev
5 (1)
The indicator displays the data of the standard ADX indicator from a higher timeframe on the chart. Several indicators with different timeframe settings can be placed on a single chart. The indicator parameters TimeFrame - time frame of the data (drop-down list) can not be lower than current AdxPeriod - period of the indicator for a higher timeframe AdxPrice - prices for the calculation of the indicator data from a higher timeframe
MACD Divergence
Sergey Deev
2.5 (2)
The indicator detects divergence signals - the divergences between the price peaks and the MACD oscillator values. The signals are displayed as arrows in the additional window and are maintained by the messages in a pop-up window, e-mails and push-notifications. The conditions which formed the signal are displayed by lines on the chart and in the indicator window. Indicator Parameters MacdFast - fast MACD line period MacdSlow - slow MACD line period MacdSignal - MACD signal line period MacdPric
The indicator detects and displays М. Gartley's Butterfly pattern. The pattern is plotted by the extreme values of the ZigZag indicator (included in the resources, no need to install). After detecting the pattern, the indicator notifies of that by the pop-up window, a mobile notification and an email. The pattern and wave parameters are displayed on the screenshots. The default parameters are used for demonstration purposes only in order to increase the amount of detected patterns. Parameters z
The indicator displays the averaged value of the moving averages of the current and two higher timeframes with the same parameters on the chart. If the moving averages are located one above the other, the resulting one is painted in green, showing an uptrend, in the opposite direction - red color (downtrend), intertwined - yellow color (transitional state) The indicator parameters MaPeriod - moving average period MaMethod - moving average method (drop-down list) MaShift - moving average shift M
The indicator displays the price movement on the chart, which is smoothed by the root mean square function. The screenshot shows the moving average with period 20, the smoothed root mean square (red) and simple SMA (yellow). The indicator parameters MAPeriod - Moving average period MaPrice - applied price (drop down list, similar to the standard MovingAverage average) BarsCount - number of processed bars (reduces download time when attaching to the chart and using in programs).
The indicator displays the standard price deviation from the root mean moving average line in the additional window. The screenshot displays the standard indicator (the lower one) and SqrtDev (the upper one). Parameters SqrtPeriod - root mean line and standard deviation period. SqrtPrice - applied price (drop-down list). BarsCount - amount of processed bars (reduces the download time when applying to a chart and using in programs).
The indicator detects and displays the 5-0 harmonic pattern on the chart according to the scheme provided in the screenshot. The pattern is plotted by the extreme values of the ZigZag indicator (included in the resources, does not require additional installation). After detecting the pattern, the indicator notifies of that by the pop-up window, a mobile notification and an email. The indicator highlights not only the complete figure, but also the time of its formation. During the formation the f
The indicator detects and displays the AB=CD harmonic pattern on the chart according to the scheme provided in the screenshot. The pattern is plotted by the extreme values of the ZigZag indicator (included in the resources, does not require additional installation). After detecting the pattern, the indicator notifies of that by the pop-up window, a mobile notification and an email. The indicator highlights not only the complete figure, but also the time of its formation. During the formation the
The indicator detects and displays the White Swan and Black Swan harmonic pattern on the chart according to the scheme provided in the screenshot. The pattern is plotted by the extreme values of the ZigZag indicator (included in the resources, does not require additional installation). After detecting the pattern, the indicator notifies of that by the pop-up window, a mobile notification and an email. The indicator highlights not only the complete figure, but also the time of its formation. Duri
The indicator detects and displays Shark harmonic pattern (see the screenshot). The pattern is plotted by the extreme values of the ZigZag indicator (included in the resources, no need to install). After detecting the pattern, the indicator notifies of that by a pop-up window, a mobile notification and an email. The indicator highlights the process of the pattern formation and not just the complete pattern. In the former case, it is displayed in the contour triangles. After the pattern is comple
The indicator detects and displays 3 Drives harmonic pattern (see the screenshot). The pattern is plotted by the extreme values of the ZigZag indicator (included in the resources, no need to install). After detecting the pattern, the indicator notifies of that by a pop-up window, a mobile notification and an email. The indicator highlights the process of the pattern formation and not just the complete pattern. In the former case, it is displayed in the contour triangles. After the pattern is com
The indicator detects and displays Cypher harmonic pattern also known as Anti-Butterfly (see the screenshot). The pattern is plotted by the extreme values of the ZigZag indicator (included in the resources, no need to install). After detecting the pattern, the indicator notifies of that by a pop-up window, a mobile notification and an email. The indicator highlights the process of the pattern formation and not just the complete pattern. In the former case, it is displayed in the contour triangle
The indicator displays ZigZag lines from a higher timeframe (see the example in the screenshot). The red thin line is the current timeframe's ZigZag, while a thicker yellow line is the higher timeframe's one. The indicator is repainted as the data is updated. Parameters Depth, Dev, Back - ZigZag parameters; BarsCount - amount of processed bars (reduces the initial download time and decreases the load when using in an EA); TimeFrame - indicator timeframe (cannot be lower than the current one).
RenkoMaSignals
Sergey Deev
1 (2)
The indicator displays Renko bars on the chart, plots two moving averages by them and generates buy/sell signals based on the conditions displayed in the screenshots and described below: the buy signal is formed if the fast moving average is above the slow moving average, from 4 to 10 consecutive bullish Renko bars are displayed, followed by no more than 2 bearish and one bullish Renko bars; the sell signal is formed if the fast moving average is below the slow moving average, from 4 to 10 conse
The indicator displays renko bars on a chart, use them to plot MACD histogram and provides buy/sell signals: signal of MACD histogram crossing its signal line; signal of MACD histogram crossing the line 0. Renko is a non-trivial price display method. Instead of displaying each bar within a time interval, only the bars where the price moved a certain number of points are shown. Renko bars do not depend on a time interval, therefore the indicator works on any timeframe without losing its efficienc
RenkoMaStoch
Sergey Deev
1 (1)
The indicator displays renko bars on a chart, uses them to plot the fast and slow moving average and Stochastic, as well as it provides buy/sell signals: a buy signal is generated when the fast moving is above the slow one, and the signal line of Stochastic crosses the lower level from bottom up; a sell signal is generated when the fast moving is below the slow one, and the signal line of Stochastic crosses the upper level from top to bottom; Renko is a non-trivial price display method. Instead
The indicator displays Renko bars on the chart and uses them to plot the ZigZag - trend lines connecting the local Lows and Highs of the price movement. Renko - specialized display of the price action, in which the graph is displayed not every bar of the time frame, but only under the condition that the price had passed more than the specified number of points. Renko bars are not bound to a time frame, so the indicator can work on any time frame with the same efficiency. This implementation of t
The indicator displays Renko bars on the chart, uses them to plot the ZigZag - trend lines connecting the local Lows and Highs of the price movement, and highlights them based on the Gartley patterns, showing the potential price reversal points. Renko - specialized display of the price action, in which the graph is displayed not every bar of the time frame, but only under the condition that the price had passed more than the specified number of points. Renko bars are not bound to a time frame, s
The indicator displays renko bars on a chart, uses them to plot the MACD oscillator and determines the divergence conditions (divergences of price movements and oscillator values). The buy/sell signal is formed if the next High/Low price is not confirmed by the oscillator values. The ZigZag indicator is used to evaluate the extremums. Only the last 3 peaks are taken into account (see the screenshot). If peak 1 is higher than peak 2 or peak 3, and at the same time the macd value is lower, then a
The indicator displays renko bars on a chart and uses them to create ZigZag indicator - trend lines connecting local price movement Highs and Lows. The indicator, in turn, is used to create AB=CD displaying potential price reversal points. Renko is a non-trivial price display method. Instead of displaying each bar within a time interval, only the bars where the price moved a certain number of points are shown. Renko bars do not depend on a time interval, therefore the indicator works on any time
The indicator calculates and displays renko bars using MA and PSAR data as well as provides buy/sell signals. Renko is a non-trivial price display method. Instead of displaying each bar within a time interval, only the bars where the price moved a certain number of points are shown. Renko bars do not depend on a time interval, therefore the indicator works on any timeframe without losing its efficiency. Buy signal forms when PSAR readings are moving down, MA is moving up, the price is closing ab
The indicator displays Renko bars on the chart, uses their data to calculate and display the moving average, PriceChannel and generates buy/sell signals. Renko is a non-trivial price display method. Instead of displaying each bar within a time interval, only the bars where the price moved a certain number of points are shown. Renko bars do not depend on a time interval, therefore the indicator works on any timeframe without losing its efficiency. The PriceChannel indicator displays the upper, lo
Filtrer:
[Supprimé] 2019.01.14 06:42 
 

L'utilisateur n'a laissé aucun commentaire sur la note

Gennadiy Voltornist
11909
Gennadiy Voltornist 2017.12.21 20:40 
 

L'utilisateur n'a laissé aucun commentaire sur la note

Daniel Andrejczuk
5597
Daniel Andrejczuk 2017.11.09 13:42 
 

L'utilisateur n'a laissé aucun commentaire sur la note

Nork
6187
Nork 2016.03.27 04:03 
 

L'utilisateur n'a laissé aucun commentaire sur la note

Rodrigo da Silva Boa
7137
Rodrigo da Silva Boa 2016.03.11 03:47 
 

L'utilisateur n'a laissé aucun commentaire sur la note

Répondre à l'avis