Classic Support Resistance
- Indicadores
-
Robby Suhendrawan
 🎯 MT4 & MT5 Expert Developer | 10+ Years of Trading Experience | Smart Money & Institutional Concepts Specialist
Transforming complex trading visions into high-performance algorithmic realities since 2014. - Versión: 3.6
- Actualizado: 8 junio 2026
- Activaciones: 9
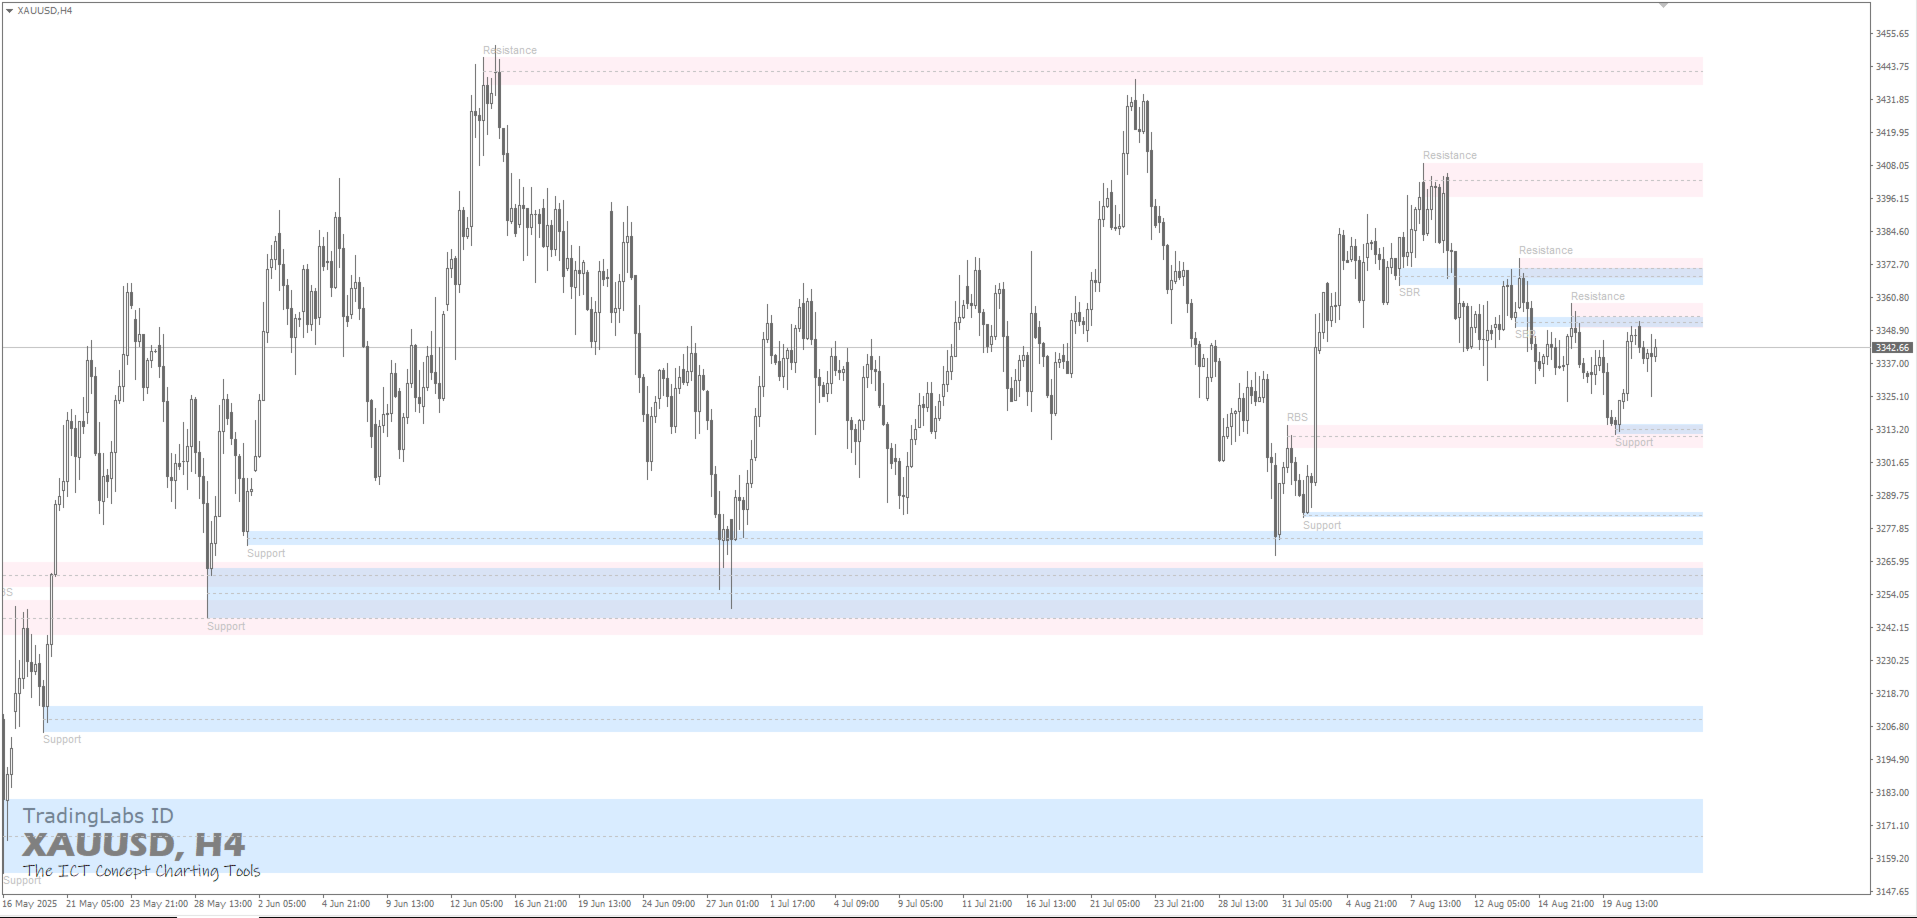
Nivelesclásicos de soporte y resistencia
¿Cansado de trazar manualmente los niveles de soporte y resistencia?
Ahora puedes ahorrar tiempo y operar con confianza utilizando el indicador Classic Support & Resistance. Esta herramienta traza automáticamente las zonas clave de soporte y resistencia en tu gráfico de MT4 con gran precisión y una visualización clara.
Diseñado especialmente para traders que se basan en estrategias de entrada de ruptura y reteste y en el análisis de la estructura del mercado.
Características principales:-
Zonas automáticas de soporte y resistencia
Identifica y traza automáticamente las principales zonas de soporte y resistencia, sin necesidad de dibujarlas manualmente. -
Visualización personalizable
Personaliza tu gráfico con colores personalizados para las zonas de soporte y resistencia (por ejemplo, LavenderBlush para la resistencia, Sky Blue para el soporte). -
Compatible con múltiples marcos temporales
Recomendado para marcos temporales superiores (H1, H4, diario) para filtrar el ruido del mercado y aumentar la precisión. -
Ideal para rupturas y retests
Perfecto para traders que operan con entradas de ruptura y retest, lo que facilita la identificación de posibles zonas de entrada con gran precisión. -
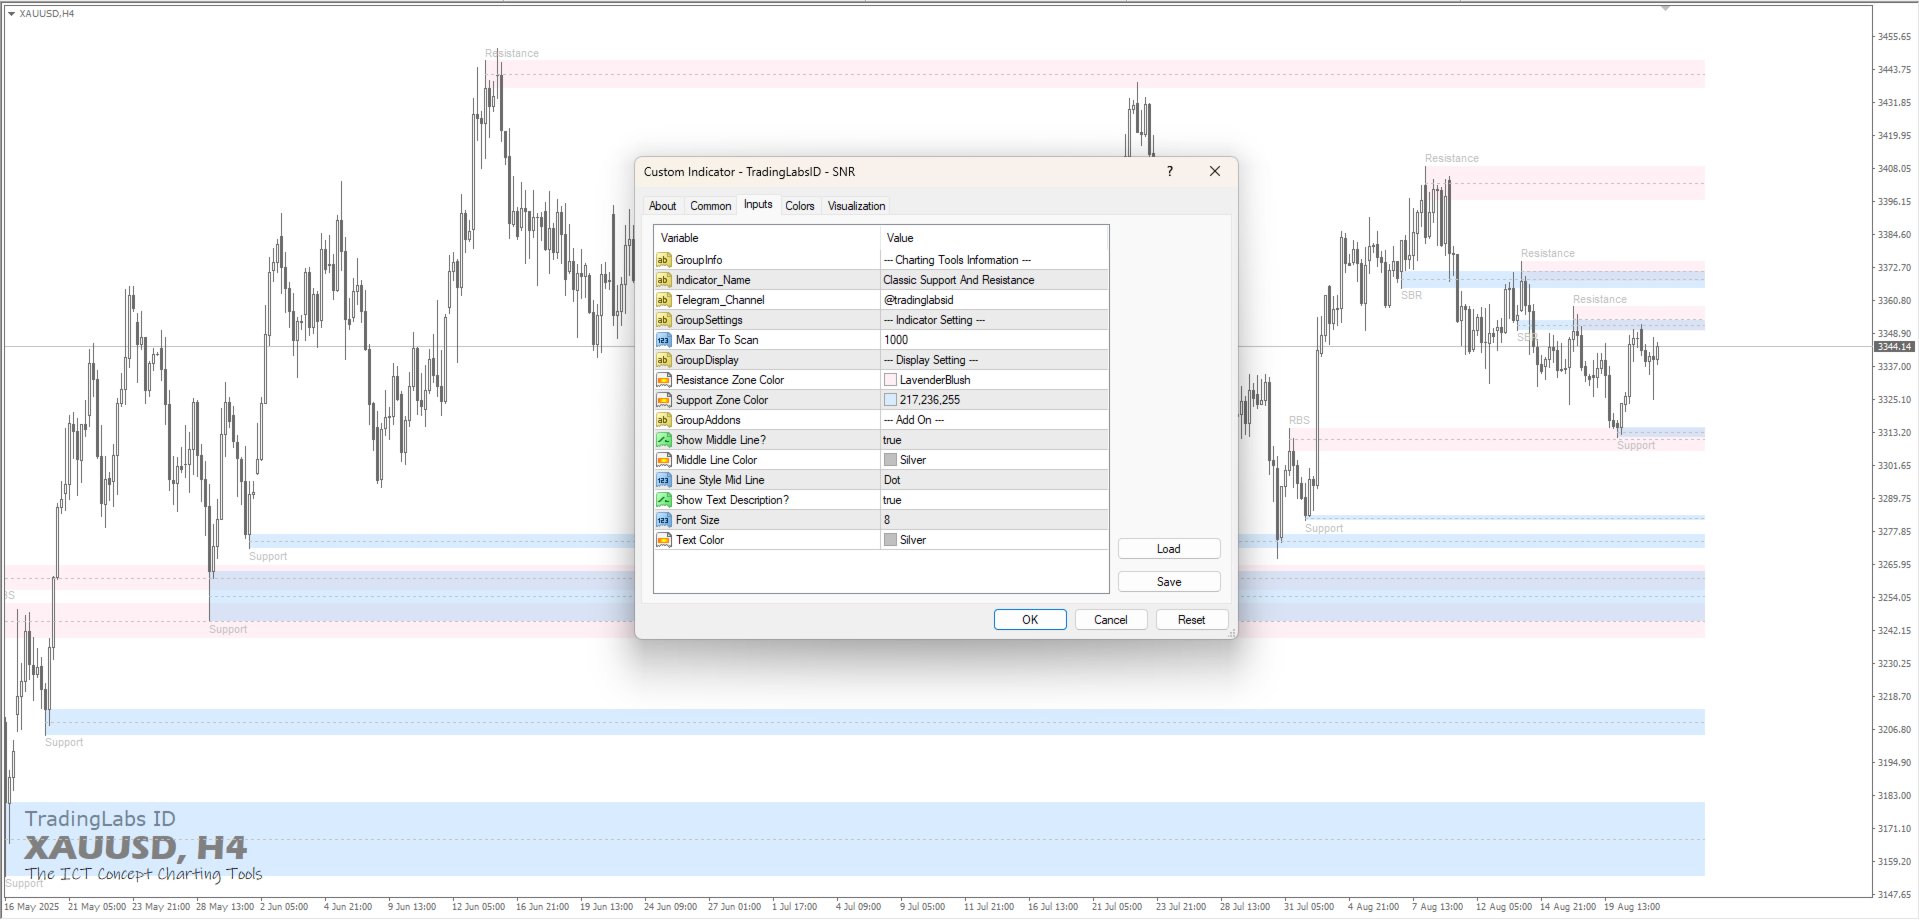
Configuración flexible
-
Número máximo de barras para escanear (hasta 1000 barras)
-
Mostrar/ocultar línea central
-
Tamaño de fuente y color de texto ajustables
-
Varios estilos de línea (punto, continua, etc.)
-
-
Detección de RBS y SBR
Marca automáticamente los niveles en los que la resistencia se convierte en soporte (RBS) y el soporte se convierte en resistencia (SBR).
- Céntrate más en la ejecución en lugar de en la creación manual de gráficos.
- Identifica rápidamente y con claridad los niveles de precios importantes.
- Adecuado para scalping, swing trading e intradía.
- Apto para principiantes y fácil de usar.
-
Marcos temporales: H1, H4, diario
-
Pares: Funciona con Forex, oro (XAUUSD), índices y criptomonedas en MT4
-
Estrategias: ruptura, entrada tras reteste, trading basado en la oferta y la demanda
Con este indicador, operarás de forma más sistemática, reducirás las decisiones emocionales y aumentarás la probabilidad de entrar en los mejores niveles.
ATTENTION! Download the free demo before purchasing. Backtesting is mandatory before trading on a REAL account.
--- La versión para MT5 ya está aquí ---
https://www.mql5.com/en/market/product/147688
ASISTENCIA TÉCNICA Y OPINIONES
Your success is my priority. If you love this product, I would greatly appreciate a 5-star review! If you need any assistance with setup or have feature requests, please send me a direct message before leaving feedback. I am always here to help.
Suscríbete al canal de TradingLabs ID:https://www.mql5.com/en/channels/tradinglabsid
Echa un vistazo a todas mis herramientas de trading premium:https://www.mql5.com/en/users/suhendrawan/seller
Ponte en contacto conmigo para recibir asistencia rápida:https://www.mql5.com/en/users/suhendrawan