Classic Support Resistance
- 지표
-
Robby Suhendrawan
 MT4 & MT5 전문 개발자 | 12년 이상의 트레이딩 경력
2014년부터 복잡한 트레이딩 아이디어를 고성능 알고리즘 시스템으로 구현해 왔습니다. 저는 금융 시장에서 10년 넘게 활동해 온 전업 트레이더이자 개발자입니다. 2014년 여정을 시작한 이래, 고전적인 기술적 분석부터 최신 ICT 및 SMC(Smart Money Concepts) 방법론에 이르기까지 다양한 트레이딩 기법을 깊이 있게 연구해 왔습니다. - 버전: 3.6
- 업데이트됨: 8 6월 2026
- 활성화: 9
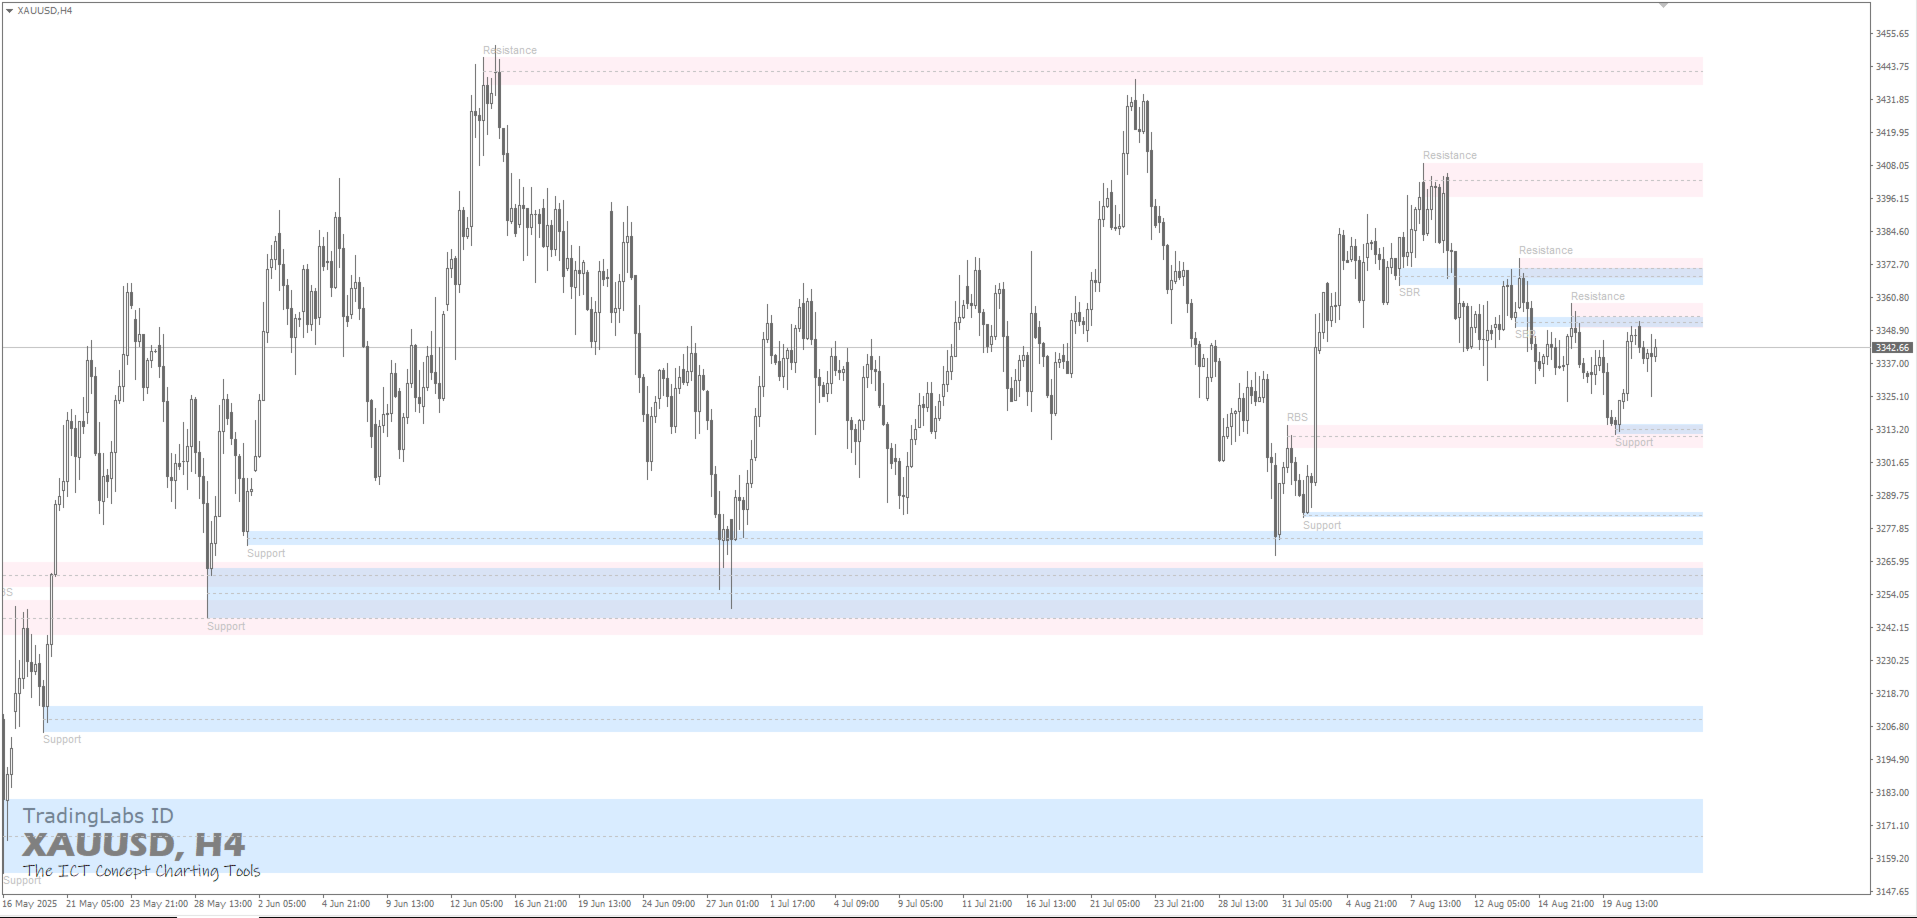
Classic Support & Resistance
Tired of drawing support and resistance levels manually?
Now you can save time and trade with confidence using the Classic Support & Resistance Indicator. This tool automatically plots key support and resistance zones on your MT4 chart with high accuracy and clean visualization.
Designed especially for traders who rely on Breakout – Retest Entry strategies and market structure analysis.
Key Features:-
Auto Support & Resistance Zones
Automatically identifies and plots major support and resistance zones, no more manual drawing needed. -
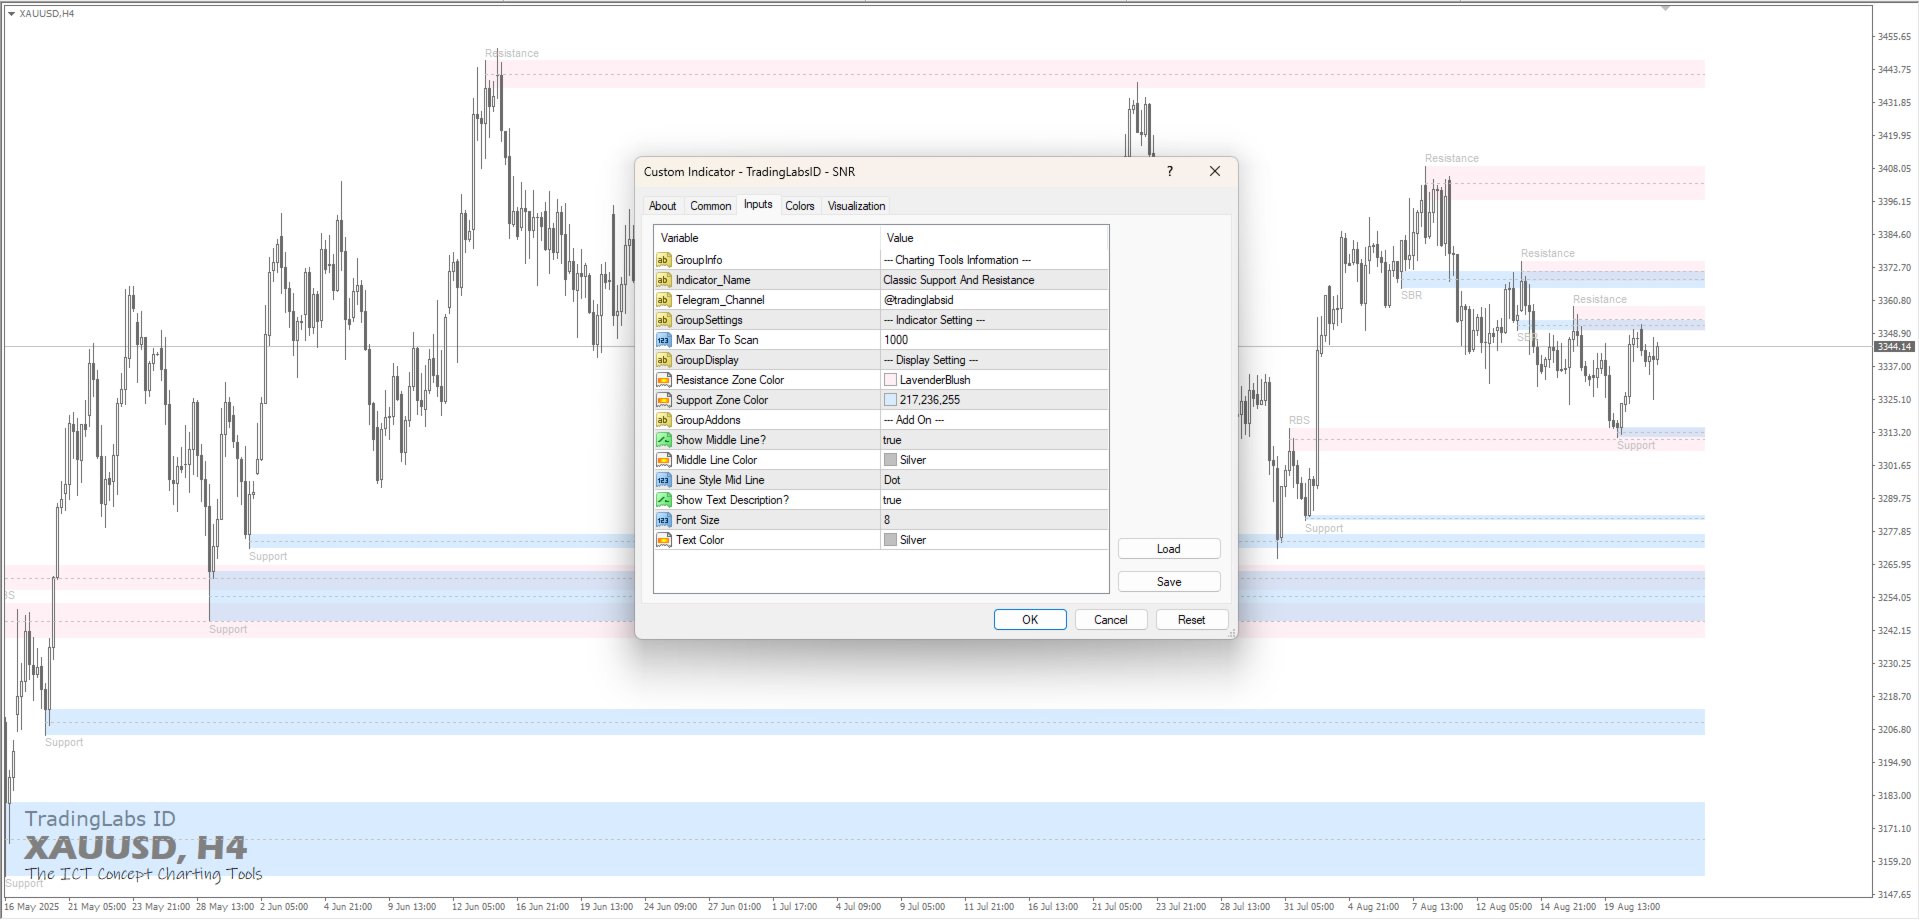
Customizable Display
Personalize your chart with custom colors for Support & Resistance zones (e.g., LavenderBlush for Resistance, Sky Blue for Support). -
Multi-Timeframe Support
Recommended for Higher Timeframes (H1, H4, Daily) to filter out market noise and increase accuracy. -
Breakout & Retest Friendly
Perfect for traders who trade breakout and retest entries, making it easier to spot potential entry zones with high precision. -
Flexible Settings
-
Max Bar to Scan (up to 1000 bars)
-
Show/Hide Middle Line
-
Adjustable Font Size & Text Color
-
Multiple Line Styles (dot, solid, etc.)
-
-
RBS & SBR Detection
Automatically marks levels where Resistance turns into Support (RBS) and Support turns into Resistance (SBR).
- Focus more on execution instead of manual charting.
- Quickly identify important price levels with clarity.
- Suitable for Scalping, Swing Trading, and Intraday.
- Beginner-friendly and easy to use.
-
Timeframes: H1, H4, Daily
-
Pairs: Works on Forex, Gold (XAUUSD), Indices, and Crypto in MT4
-
Strategies: Breakout, Retest Entry, Supply & Demand-based Trading
With this indicator, you’ll trade more systematically, reduce emotional decisions, and increase the probability of entering at the best levels.
ATTENTION! Download the free demo before purchasing. Backtesting is mandatory before trading on a REAL account.
--- MT5 Version is here ---
https://www.mql5.com/en/market/product/147688
SUPPORT & REVIEWS
Your success is my priority. If you love this product, I would greatly appreciate a 5-star review! If you need any assistance with setup or have feature requests, please send me a direct message before leaving feedback. I am always here to help.
Subscribe to TradingLabs ID Channel: https://www.mql5.com/en/channels/tradinglabsid
Check out all my premium trading tools: https://www.mql5.com/en/users/suhendrawan/seller
Contact me for fast support: https://www.mql5.com/en/users/suhendrawan