Professional Grade ATR And Volume Dashboard
- Indicadores
- Jason Smith
- Versión: 1.0
- Activaciones: 5
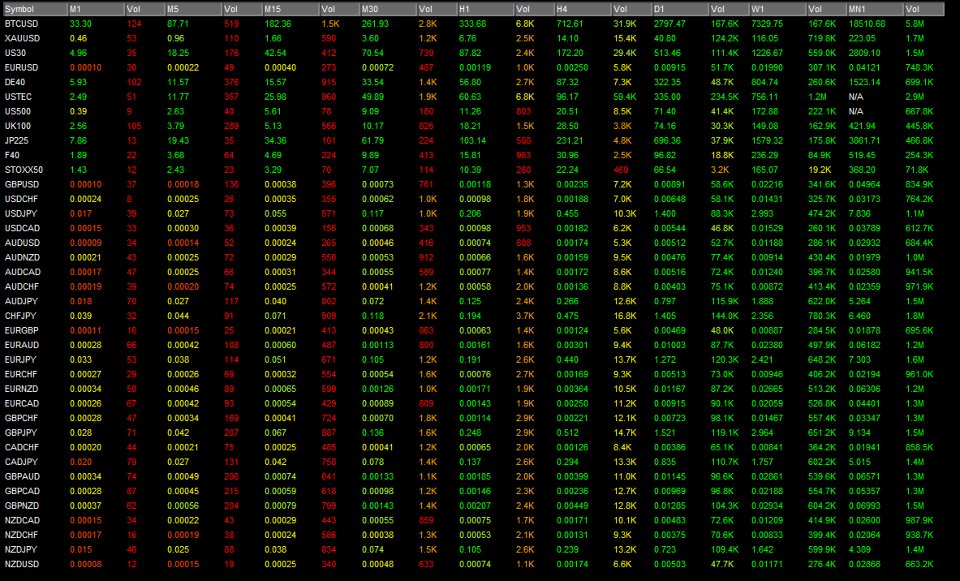
Finally, a dashboard that cuts through the noise and shows what actually matters.– Displays All Symbols In Your Market Watch List (Updates in real time)
This advanced Multi-Timeframe ATR & Volume Dashboard gives traders a crystal-clear view of market volatility and liquidity across all symbols and timeframes in one glance.
Real-Time ATR & Volume Data – See exact volatility (ATR) and trading activity (Volume) for M1 to MN1
Smart Grouping – Automatically classifies instruments (Forex, Indices, Commodities, Crypto)
Relative Strength Matrix – Instantly spot the most volatile and most liquid markets
This dashboard presents Average True Range (ATR) values and trading volumes across multiple timeframes for various financial instruments including forex pairs, commodities, and indices.
The data allows for volatility and liquidity comparison across different time horizons.
How to Use It:
Scan for opportunities – High ATR + High Volume = Strong trends
Set smarter stops – Use precise ATR values to adjust risk
Filter noise – Avoid low-volume instruments with erratic moves
Day Traders should focus on instruments with higher intraday and hourly ATR values for sufficient price movement.
Swing Traders may prefer instruments with balanced volatility across MTF
Position Traders should consider instruments with strong volume in monthly timeframes for better liquidity.
For Risk Management:
Stop-loss placement should consider the ATR values in the relevant timeframe.
Position sizing can be adjusted based on volatility - smaller positions for higher ATR instruments.
Volume data helps identify the most liquid timeframes for entering/exiting positions.
This dashboard provides valuable multi-timeframe perspective on both volatility (through ATR) and liquidity (through volume).
The most actively traded instruments with consistent volatility patterns (like XAUUSD, EURUSD, and US30) may offer the most reliable trading opportunities across different time horizons.
Traders should align their strategies with instruments whose volatility and volume characteristics match their preferred holding periods.
NOTE: Remove The grid from your chart. Change candles to a line chart. Change the line to black and level it out. You will get a clear screen with out candles cluttering your view. (Just like in the screenshot)
1. ATR (Average True Range) – Volatility Check
ATR measures how much price moves (on average) per candle.
Lower timeframes (M1–M15): Show short-term noise, useful for scalping entries/exits. A rising ATR here signals intraday momentum or breakouts.
Medium timeframes (H1–H4): Reflect intraday/intraweek rhythm. If ATR expands here, you’re seeing a broader trend or shift in volatility—better for swing setups.
Higher timeframes (D1–W1): Set the “big picture” volatility. If daily ATR is 2x the weekly average, market is in abnormal conditions—expect fast moves and wide stops.
How to use:
Align your stop loss size with ATR of your trading timeframe.
Compare lower vs. higher TF ATR. If H4 ATR is flat but M5 ATR spikes, you’re just in noise—not a real trend.
Watch for ATR compression → expansion (low volatility ranges break into high-volatility trends).
2. Volume – Liquidity & Confirmation
Volume confirms whether price moves are backed by real participation.
Lower timeframes (M1–M15): Spot liquidity bursts (news spikes, session opens). Helps avoid chasing fake moves with thin volume.
Medium timeframes (H1–H4): Confirm intraday trend strength. A breakout with weak H1 volume often fails; with strong H1 volume, it usually follows through.
Higher timeframes (D1–W1): Gauge institutional activity. Sustained high daily/weekly volume shows accumulation or distribution, not retail noise.
How to use:
Look for volume spikes aligning with ATR expansion → strong, real breakouts.
If ATR is high but volume is low → volatility without liquidity (often whipsaw).
If volume is high but ATR is low → accumulation/distribution, price is coiling before a breakout.
3. Putting ATR & Volume Together
Scalping: Use M1–M15 ATR to size stops, confirm moves with volume spikes.
Swing trading: Use H1–H4 ATR to measure trend ranges, confirm breakouts with matching volume.
Position trading: Use D1–W1 ATR to set realistic profit/stop zones, volume to confirm large player activity.
Rule of thumb: Trade when both ATR and volume expand in the same direction. Stay cautious when they diverge.

