Professional Grade ATR And Volume Dashboard

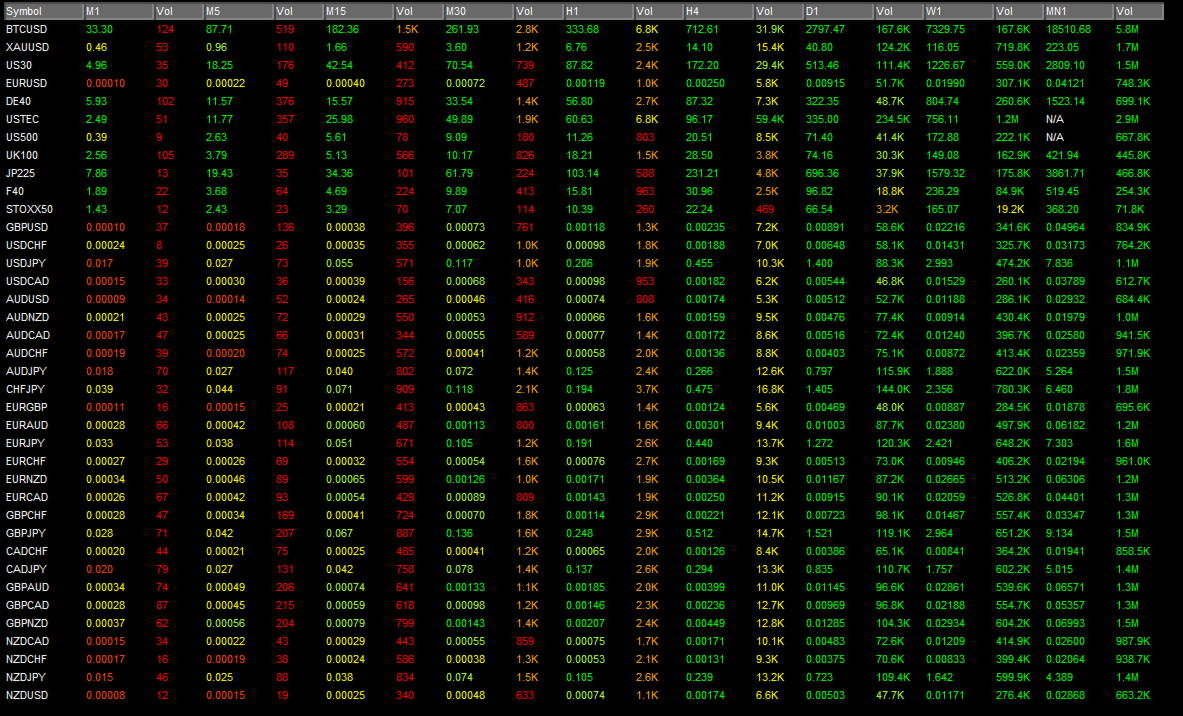
Finally, a dashboard that cuts through the noise and shows what actually matters.Displays All Symbols In Your Market Watch List (Updates in real time)

This advanced Multi-Timeframe ATR & Volume Dashboard gives traders a crystal-clear view of market volatility and liquidity across all symbols and timeframes in one glance.

    Real-Time ATR & Volume Data – See exact volatility (ATR) and trading activity (Volume) for M1 to MN1
    Smart Grouping – Automatically classifies instruments (Forex, Indices, Commodities, Crypto)
    Relative Strength Matrix – Instantly spot the most volatile and most liquid markets

This dashboard presents Average True Range (ATR) values and trading volumes across multiple timeframes for various financial instruments including forex pairs, commodities, and indices.

The data allows for volatility and liquidity comparison across different time horizons.

How to Use It:
     Scan for opportunities – High ATR + High Volume = Strong trends
     Set smarter stops – Use precise ATR values to adjust risk
     Filter noise – Avoid low-volume instruments with erratic moves
     Day Traders should focus on instruments with higher intraday and hourly ATR values for sufficient price movement.
     Swing Traders may prefer instruments with balanced volatility across MTF
     Position Traders should consider instruments with strong volume in monthly timeframes for better liquidity.
        
     For Risk Management:
     Stop-loss placement should consider the ATR values in the relevant timeframe.
     Position sizing can be adjusted based on volatility - smaller positions for higher ATR instruments.
     Volume data helps identify the most liquid timeframes for entering/exiting positions.

This dashboard provides valuable multi-timeframe perspective on both volatility (through ATR) and liquidity (through volume).
The most actively traded instruments with consistent volatility patterns (like XAUUSD, EURUSD, and US30) may offer the most reliable trading opportunities across different time horizons. 
Traders should align their strategies with instruments whose volatility and volume characteristics match their preferred holding periods.

NOTE: Remove The grid from your chart. Change candles to a line chart. Change the line to black and level it out. You will get a clear screen with out candles cluttering your view. (Just like in the screenshot)

1. ATR (Average True Range) – Volatility Check
ATR measures how much price moves (on average) per candle.
Lower timeframes (M1–M15): Show short-term noise, useful for scalping entries/exits. A rising ATR here signals intraday momentum or breakouts.
Medium timeframes (H1–H4): Reflect intraday/intraweek rhythm. If ATR expands here, you’re seeing a broader trend or shift in volatility—better for swing setups.
Higher timeframes (D1–W1): Set the “big picture” volatility. If daily ATR is 2x the weekly average, market is in abnormal conditions—expect fast moves and wide stops.

How to use:
Align your stop loss size with ATR of your trading timeframe.
Compare lower vs. higher TF ATR. If H4 ATR is flat but M5 ATR spikes, you’re just in noise—not a real trend.
Watch for ATR compression → expansion (low volatility ranges break into high-volatility trends).

2. Volume – Liquidity & Confirmation
Volume confirms whether price moves are backed by real participation.
Lower timeframes (M1–M15): Spot liquidity bursts (news spikes, session opens). Helps avoid chasing fake moves with thin volume.
Medium timeframes (H1–H4): Confirm intraday trend strength. A breakout with weak H1 volume often fails; with strong H1 volume, it usually follows through.
Higher timeframes (D1–W1): Gauge institutional activity. Sustained high daily/weekly volume shows accumulation or distribution, not retail noise.

How to use:
Look for volume spikes aligning with ATR expansion → strong, real breakouts.
If ATR is high but volume is low → volatility without liquidity (often whipsaw).
If volume is high but ATR is low → accumulation/distribution, price is coiling before a breakout.

3. Putting ATR & Volume Together
Scalping: Use M1–M15 ATR to size stops, confirm moves with volume spikes.
Swing trading: Use H1–H4 ATR to measure trend ranges, confirm breakouts with matching volume.
Position trading: Use D1–W1 ATR to set realistic profit/stop zones, volume to confirm large player activity.

Rule of thumb: Trade when both ATR and volume expand in the same direction. Stay cautious when they diverge.


추천 제품
Pivot Reversal Free
Fyodor Korotkov
5 (1)
Hi there! Since I am starting commercial and non-commercial product publishing I would highly appreciate: If you like this product, please rate it. That will help to promote not only this product, but indirectly another ones. So, such promotion will help to make some money from commercial products. Thus, I will have opportunity to fund my another directions of trading researches like bot development using mql4 and mql5 programming languages as well as python written products like crypto bots. If
FREE
Indicator Description Range Filter Pro is a sophisticated trading tool for XAUUSD (Gold) that combines adaptive price filtering with volume analysis and real-time market monitoring. Designed for both novice and professional traders, this indicator helps identify trend direction, potential reversals, and significant market movements through its multi-layered approach. Key Components 1.Dynamic Range Filter 2.Volatility-Adjusted Bands 3.Volume-Enhanced Candles 4.Professional Trading Dashboard 5.M
FREE
Amiguinhos Bar Counter
Eduardo Correia Da Silva
3.67 (3)
Amiguinho's Bar Counter is a price action indicator to display the bar count (candles) with some interesting options. About the "Period of analysis" parameter: if the current timeframe is in minutes, then the analysis period will be considered in days; if the current timeframe is in days, then the analysis period will be considered in months; or  if the period of analysis will be considered in years.
FREE
Macro-R Pro Signal — Advanced Trading Signal Indicator Macro-R Pro Signal is a professional trading indicator designed to deliver high-quality BUY and SELL signals with enhanced precision and reduced market noise. By combining Bollinger Bands, RSI, and adaptive volatility filtering , this indicator helps traders identify high-probability reversal points while avoiding unfavorable market conditions. How the Strategy Works This indicator is built on a mean reversion + momentum confirmation concep
FREE
VFI Quantum
Nikita Berdnikov
5 (1)
Introducing VFI (Volume Flow Indicator) – a trading indicator that analyzes the relationship between volume and price movement to identify key trading opportunities. The indicator displays the strength and direction of volume flow, providing clear signals about potential entry and exit points. Signals are formed based on zero line crossovers, crossovers between the VFI line and its exponential moving average (EMA), and when the indicator exits overbought and oversold zones. Attention! This stra
FREE
B2U Market State System Part of the B2U Market State System A professional indicator suite designed to analyze market structure, trend state, and momentum. B2U Market State System 의 구성 요소입니다. 시장 구조, 추세 상태, 모멘텀을 입체적으로 분석하기 위한 전문 인디케이터 시스템입니다. Highlights structurally validated reaction zones after FVG inversion. The New Generation of Inversion Fair Value Gaps B2U IFVG BOX & Zone visually analyzes market reaction zones formed after Fair Value Gap (FVG) inversion. 차세대 Inversion Fair Value Gaps FVG 반
FREE
Bneu GLA Indicator
Marvinson Salavia Caballero
``` Bneu GLA Trend Indicator — Grover Llorens Activator This indicator for MetaTrader 5 displays a dynamic trend activation line based on the Grover Llorens Activator method. The line changes color based on price position relative to the activation level, with signal arrows appearing on trend changes. What It Does Plots a dynamic activation line on your chart: - Green line when price is above (bullish condition) - Red line when price is below (bearish condition) - Arrows appear on trend cha
FREE
Phoenix Candle Timer Panel
PHOENIX GLOBAL INVESTMENTS LTD
피닉스 캔들 타이머 패널 (MT5) 메타트레이더 5용 실시간 캔들 카운트다운 타이머. 현재 캔들의 정확한 잔여 시간을 표시하여 실행 타이밍과 거래 규율을 개선합니다. 목적 정확한 캔들 타이밍은 재량 거래자와 알고리즘 전략 모두에게 중요합니다. 캔들 내 진입 시점이 너무 빠르거나 늦으면 위험, 스프레드 노출 및 신호 유효성에 영향을 미칠 수 있습니다. 피닉스 캔들 타이머 패널은 브로커 서버 시간과 동기화된 명확한 카운트다운 가시성을 제공합니다. 타이머는 차트 시간대 변경에 자동으로 적응하고 실시간으로 업데이트되어 추측을 없애고 모든 시간대에서 실행 정밀도를 향상시킵니다. 설치 MQL5 마켓에서 다운로드하여 차트에 부착하세요. 타이머 패널이 즉시 표시되며 별도 설정 없이 사용 가능합니다. 요구 사항 MetaTrader 5 빌드 3280 이상. 차트에서 실행해야 하는 전문가 자문(EA)입니다. 브로커 서버 시간을 사용하며 모든 심볼과 시간대에서 작동합니다. 피드백 및 리뷰
FREE
Market Hours Pro
Musa Terrance Khosa
Market Hours Pro shows Tokyo, London, and New York trading sessions directly on your MT5 chart, including scheduled overlap periods. It’s designed to give you a clear view of global market timing so you can plan trades, spot high-activity periods, and align strategies with standard Forex hours. How It Works Displays scheduled session times visually on your chart. Highlights session overlaps for London/New York and Tokyo/London. Automatically adjusts times for your timezone or broker time. Shows
FREE
Volume Statistic
Syamsurizal Dimjati
5 (1)
Ritz Volume Statistic – Color Volume Histogram & Market Flow Insight Ritz Volume Statistic is a clean and powerful volume analysis indicator designed to visualize bullish and bearish market pressure through a dynamic color-graded volume histogram . The indicator transforms raw tick volume into an intuitive color spectrum , allowing traders to instantly identify volume expansion, exhaustion, and dominance shifts between buyers and sellers. A built-in statistical panel summarizes total volume, bul
FREE
Touch VWAP MT5
Danrlei Hornke
O Touch VWAP é um indicador que permite calcular uma Média Ponderada por Volume (VWAP) apenas apertando a tecla 'w' no seu teclado e após clicando no candle do qual deseja realizar o calculo, clicando abaixo do candle é calculada a VWAP baseado na minima dos preços com o volume, clicando sobre o corpo do candle é calculado uma VWAP sobre o preço medio com o volume e clicando acima do candle é calculado uma VWAP baseado na máxima dos preços com o volume, voce tambem tem a opção de remover a VWAP
Trendlines with Breaks (TWB) — Trading Guide What Is It? Trendlines with Breaks is an auto-drawn trendline indicator that detects swing pivots, draws dynamic upper/lower trendlines, and fires breakout signals when price closes beyond those lines. No more manually drawing and adjusting trendlines — the indicator does it systematically. *** Group support:  https://www.mql5.com/en/channels/vuongphamtrading Core Settings Parameter Default What It Does Swing Detection Lookback 14 Bars left & right t
Important Lines
Terence Gronowski
4.88 (24)
This indicator displays Pivot-Lines, preday high and low, preday close and the minimum and maximum of the previous hour. You just have to put this single indicator to the chart to have all these important lines, no need to setup many single indicators. Why certain lines are important Preday high and low : These are watched by traders who trade in a daily chart. Very often, if price climbs over or falls under a preday low/high there is an acceleration in buying/selling. It is a breakout out of a
FREE
This indicator is stand alone version from  MP Pivot Levels  (All in one) containing Demark's Pivots. Calculations:     PP = X / 4     R1 = X / 2 - LOWprev     S1 = X / 2 - HIGHprev Uses: When the pair currency price may change the direction of movement. Possible constraints of support and resistance that creates plateaus for the currency pair prices. Tendency identification by comparing the present prices according to current day's pivot point and also the prior day's pivot points. ____________
FREE
AliPivot Points
Alexandra Voicu
AliPivot Points is a Meta Trader 5 Indicator that draws you the latest pivot points. You can choose from timeframes ranging from 1 Minute to 1 Month. Calculation methods for pivot points includes: Classic Pivot Points Camarilla Pivot Points Fibonacci Pivot Points Woodie Pivot Points You can personalize the line colors, style, and width to suit your preference. The indicator displays values on the right side of the chart. AliPivot Points values can also be utilized by developers for creating Expe
FREE
Pivot Points are a classic technical analysis indicator that calculates the central pivot point (PP) as well as support (S1–S3) and resistance (R1–R3) levels based on the previous day’s High, Low, and Close. The indicator allows you to: • identify key zones where the price may bounce or break through • determine the direction of the trend • find good entry points, as well as set stop loss and take profit levels Indicator settings: • enable/disable PP, R1/S1, R2/S2, R3/S3 • enable/disable price l
FREE
This EA finds Fair Value Liquidity (FVL) on the chart, tracks when they get mitigated , and then looks for an inversion signal (price “fails” through the zone). When that inversion happens, it places a trade in the opposite direction of the original Liquidity gap (an Inverse FVG approach). It also lets you control when it trades using market sessions , and it can auto-close positions at New York open (all positions or profitable-only). Key advantages Clear, rule-based entries (no guessing): trad
FREE
(Special New Year promotion - free price!) The indicator displays the actual 'Scale in points per bar' (identical to the manual setting in the Terminal, see screenshot) in the upper right corner of the chart. The displayed value changes INSTANTLY whenever the chart scale is changed! (This is very convenient when planning screenshots). In Settings: Change language (Russian/English), font size of the displayed text, text label offset coefficient from the graph corner, equally in X and Y directi
FREE
QuantumAlert Stoch Navigator is a free indicator available for MT4/MT5 platforms, its work is to provide "alerts" when the market is inside "overbought and oversold" regions in the form of "buy or sell" signals. This indicator comes with many customization options mentioned in the parameter section below, user can customise these parameters as needful. Join our   MQL5 group , where we share important news and updates. You are also welcome to join our private channel as well, contact me for the p
FREE
Support Resistance Indicator The "Support Resistance" indicator is a versatile tool designed to help traders identify key support and resistance levels based on an underlying algorithm. These levels indicate price points where an asset historically experiences buying (support) or selling (resistance) pressure. The indicator allows traders to visualize these levels on their charts, making it easier to make informed decisions. All Products   |   Contact PARAMETERS: Timeframe : Users can select the
FREE
QuantumAlert RSI Navigator is a free indicator available for MT4/MT5 platforms, its work is to provide "alerts" when the market is inside "overbought and oversold" regions in the form of "buy or sell" signals. This indicator comes with many customization options mentioned in the parameter section below, user can customise these parameters as needful. Join our MQL5 group , where we share important news and updates. You are also welcome to join our private channel as well, contact me for the priva
FREE
Coral Indi
Dinh Duong Luong
Coral trend is   a trend-following indicator that is widely popular among FOREX traders . It is usually used as a confluence with other indicators. It uses combinations of moving averages with complex smoothing formulas! It has two configurable parameters: Coefficient   - smoothing ratio (*) Applied price Calculation: Coral = (-0.064) * B6 + 0.672 * B5 - 2.352 * B4 + 2.744 * B3
FREE
This indicator is based on Mr. Mark Fisher's ACD strategy, based on the book "The Logical Trader." - OR lines - A lines - C lines - Daily pivot range - N days pivot range - Customizable trading session - Drawing OR with the desired time Drawing levels A and C based on daily ATR or constant number - Possibility to display daily and last day pivots in color zone - Displaying the status of daily PMAs (layer 4) in the corner of the chart - Show the order of daily pivot placement with multi-day piv
FREE
Renko Box
Andrey Dik
5 (1)
Description. The basis for the formation of the Renko chart is the price range. If the price goes beyond its limits, the chart shows a box above or below the previous one. As a result, we see price movement without additional "noise" and important support and resistance levels. Features. For use in conjunction with the Expert Advisor, an additional buffer is implemented-a box counter. For convenience and to increase the speed of testing, the user can use the "new box" event, which the indicator
FREE
Value Chart Candlesticks
Flavio Javier Jarabeck
4.69 (13)
The idea of a Value Chart indicator was presented in the very good book I read back in 2020 , " Dynamic Trading Indicators: Winning with Value Charts and Price Action Profile ", from the authors Mark Helweg and David Stendahl. The idea is simple and the result is pure genius: Present candlestick Price analysis in a detrended way! HOW TO READ THIS INDICATOR Look for Overbought and Oversold levels. Of course, you will need to test the settings a lot to find the "correct" one for your approach. It
FREE
Pivot Classic, Woodie, Camarilla, Fibonacci and Demark Floor/Classic Pivot points, or simply pivots, are useful for identifying potential support/resistance levels, trading ranges, trend reversals, and market sentiment by examining an asset's high, low, and closing values. The Floor/Classic Pivot Points can be calculated as follows. Pivot Point (P) = (High + Low + Close)/3 S1 = P * 2 - High S2 = P - (High - Low) S3 = Low – 2*(High - P) R1 = P * 2 - Low R2 = P + (High - Low) R3 = High + 2*(P - Lo
FREE
RSI abcd
Francisco Gomes Da Silva
4.33 (3)
RSI ABCD 패턴 파인더: 기술적 전략 1. 지표 작동 방식 클래식 RSI 와 ABCD 하모닉 패턴 자동 감지를 결합합니다. 주요 구성 요소 표준 RSI (조정 가능한 기간) 고점 및 저점 마커 (화살표) ABCD 패턴 (초록/빨강 선) 과매수 (70) 및 과매도 (30) 필터 2. MT5 설정 period = 14 ; // RSI 기간 size = 4 ; // 최대 패턴 크기 OverBought = 70 ; // 과매수 수준 OverSold = 30 ; // 과매도 수준 Filter = USE_FILTER_ YES ; // 확인 필터 3. 트레이딩 전략 3.1. 매수 진입 (강세 ABCD) 조건: RSI가 다음을 형성: 저점 ( A ) → 고점 ( B ) → 더 높은 저점 ( C ) D 는 과매도 (30) 위지만 C 아래 확인: A-B-C-D 연결 초록 선 목표: TP1: B-C의 61.8% TP2: B-C의 100% 손절: D 아래 3.2. 매도 진입 (약세 ABCD) 조건:
FREE
Apt Indicator MT5
Mohamed Samsudeen
APT – Advance Pivot Trader Indicator for MetaTrader 5 APT – Advance Pivot Trader is a technical indicator developed for MetaTrader 5. The indicator is based entirely on mathematical and algorithmic calculations and is designed to analyze market structure using pivot-based logic. The indicator does not use grid techniques, martingale strategies, or position sizing methods. It provides analytical information to support structured and disciplined trading decisions. Timeframe and Risk Guidance The
FREE
Donchian Breakout And Rsi
Mattia Impicciatore
4.5 (2)
개요 이 지표는 클래식 돈치안 채널(Donchian Channel) 의 향상된 버전으로, 실전 트레이딩을 위한 다양한 기능이 추가되었습니다. 표준 세 개의 선(상단, 하단, 중앙선) 외에도 브레이크아웃 을 감지하여 차트에 화살표로 시각적으로 표시하며, 차트를 깔끔하게 보기 위해 현재 추세 방향의 반대 라인만 표시 합니다. 지표 기능: 시각적 신호 : 브레이크아웃 시 컬러 화살표 표시 자동 알림 : 팝업, 푸시 알림, 이메일 RSI 필터 : 시장의 상대 강도를 기반으로 신호 검증 사용자 맞춤 설정 : 색상, 선 두께, 화살표 코드, RSI 임계값 등 동작 원리 돈치안 채널은 다음을 계산합니다: 상단선 : 최근 N개의 종가 완료 캔들에서 가장 높은 고가 하단선 : 최근 N개의 종가 완료 캔들에서 가장 낮은 저가 중앙선 : 고가와 저가의 평균값 상방 브레이크아웃 은 종가가 상단선을 돌파할 때 발생하며, 하방 브레이크아웃 은 종가가 하단선 아래로 내려갈 때 발생합니다. 이 지표는: 세 개의
FREE
My Candle Patterns
Francisco Gomes Da Silva
5 (1)
이 지표는 My Candle Complete의 데모 버전으로, 여기에서 다운로드할 수 있습니다: Candle Patterns Creator 전체 버전을 사용하면 자신만의 캔들 규칙을 생성하고 전통적인 캔들 패턴을 전략에 맞게 수정하여 더 정확하게 조정할 수 있습니다. 이 지표에는 여러 가지 캔들 규칙 예제가 포함되어 있지만, 여기에서는 일부만을 소개합니다: Pattern Rule Candle Green C > O Candle Red C < O Doji C = O Hammer (C > O and (C-O) *2 < O-L and (C-O) *0.5 > H-C) or (C < O and (O-C) *2 < C-L and (O-C) *0.5 > H-O) Hammer Green C > O and (C-O) *2 < O-L and (C-O) *0.5 > H-C Hammer Red C < O and (O-C) *2 < C-L and (O-C) *0.5 > H-O Marubozu  (C > O
FREE
이 제품의 구매자들이 또한 구매함
Divergence Bomber
Ihor Otkydach
4.9 (86)
이 지표를 구매하신 분께는 다음과 같은 혜택이 무료로 제공됩니다: 각 거래를 자동으로 관리하고, 손절/익절 수준을 설정하며, 전략 규칙에 따라 거래를 종료하는 전용 도우미 툴 "Bomber Utility" 다양한 자산에 맞게 지표를 설정할 수 있는 셋업 파일(Set Files) "최소 위험", "균형 잡힌 위험", "관망 전략" 모드로 설정 가능한 Bomber Utility의 셋업 파일 이 전략을 빠르게 설치, 설정, 시작할 수 있도록 돕는 단계별 영상 매뉴얼 주의: 위의 모든 보너스를 받기 위해서는 MQL5 개인 메시지 시스템을 통해 판매자에게 연락해 주세요. 독창적인 커스텀 지표인 “Divergence Bomber(다이버전스 봄버)”를 소개합니다. 이 지표는 MACD 다이버전스(괴리) 전략을 기반으로 한 올인원(All-in-One) 거래 시스템입니다. 이 기술 지표의 주요 목적은 가격과 MACD 지표 간의 다이버전스를 감지하고, **향후 가격이 어느 방향으로 움직일지를 알려주는
Azimuth Pro
Ottaviano De Cicco
5 (6)
Azimuth Pro V2: Synthetic Fractal Structure and Confirmed Entries for MT5 Overview Azimuth Pro is a multi-level swing structure indicator by Merkava Labs . Four nested swing layers, swing-anchored VWAP, ABC pattern detection, three-timeframe structural filtering, and closed-bar confirmed entries — one chart, one workflow from micro-swings to macro-cycles. This is not a blind signal product. It is a structure-first workflow for traders who care about location, context, and timing. V2 Launch Offe
Quantum TrendPulse
Bogdan Ion Puscasu
5 (23)
SuperTrend   ,   RSI   ,   Stochastic   의 힘을 하나의 포괄적인 지표로 결합하여 트레이딩 잠재력을 극대화하는 궁극의 트레이딩 도구   인 Quantum TrendPulse를   소개합니다. 정밀성과 효율성을 추구하는 트레이더를 위해 설계된 이 지표는 시장 추세, 모멘텀 변화, 최적의 진입 및 종료 지점을 자신 있게 식별하는 데 도움이 됩니다. 주요 특징: SuperTrend 통합:   주요 시장 추세를 쉽게 따라가고 수익성의 물결을 타세요. RSI 정밀도:   매수 과다 및 매도 과다 수준을 감지하여 시장 반전 시점을 파악하는 데 적합하며 SuperTrend 필터로 사용 가능 확률적 정확도:   변동성이 큰 시장에서 숨겨진 기회를 찾기 위해 확률적 진동   을 활용하고 SuperTrend의 필터로 사용 다중 시간대 분석:   M5부터 H1 또는 H4까지 다양한 시간대에 걸쳐 시장을 최신 상태로 유지하세요. 맞춤형 알림:   맞춤형 거래 조건이 충족되면
OmniSync Projection
Antonio-alin Teculescu
5 (1)
Chronos Fractal Engine is an innovative price projection indicator for MetaTrader 5, designed to transform your technical analysis by intelligently identifying and projecting historical price patterns. Built upon an advanced correlation algorithm and the fractal principles of the market, this powerful tool visualizes potential future price movements, giving you a unique edge in your trading decisions. What is Chronos Fractal Engine? At its core, the Chronos Fractal Engine employs a sophisticat
소개       Quantum Breakout PRO   , 브레이크아웃 존 거래 방식을 변화시키는 획기적인 MQL5 지표! 13년 이상의 거래 경험을 가진 숙련된 트레이더 팀이 개발한       퀀텀 브레이크아웃 PRO       혁신적이고 역동적인 브레이크아웃 존 전략으로 거래 여정을 새로운 차원으로 끌어올리도록 설계되었습니다. Quantum Breakout Indicator는 5개의 이익 목표 영역이 있는 브레이크아웃 영역의 신호 화살표와 브레이크아웃 상자를 기반으로 한 손절 제안을 제공합니다. 초보자 거래자와 전문 거래자 모두에게 적합합니다. Quantum EA 채널:       여기를 클릭하세요 중요한! 구매 후 설치 매뉴얼을 받으려면 개인 메시지를 보내주십시오. 추천: 기간: M15 통화쌍: GBPJPY, EURJPY, USDJPY,NZDUSD, XAUUSD 계정 유형: 스프레드가 매우 낮은 ECN, Raw 또는 Razor 브로커 시간: GMT +3 중개인 :
CGE Trading Suite
Carl Gustav Johan Ekstrom
5 (2)
Institutional-Grade Analytics for MT5 C GE Trading Suite delivers the analytical edge typically reserved for professional trading desks. The platform integrates a full suite of analytical tools into one seamless workflow: dynamic grid mapping, liquidity behavior analysis, ECM, trend lines, MIDAS, trade cycles, and directional channel projections. Together, these provide a unified view of market structure and momentum. Directional clarity is further enhanced by the capital flow index, which meas
Grabber System MT5
Ihor Otkydach
4.83 (23)
탁월한 기술적 지표인 Grabber를 소개합니다. 이 도구는 즉시 사용 가능한 “올인원(All-Inclusive)” 트레이딩 전략으로 작동합니다. 하나의 코드 안에 강력한 시장 기술 분석 도구, 매매 신호(화살표), 알림 기능, 푸시 알림이 통합되어 있습니다. 이 인디케이터를 구매하신 모든 분들께는 다음의 항목이 무료로 제공됩니다: Grabber 유틸리티: 오픈 포지션을 자동으로 관리하는 도구 단계별 영상 매뉴얼: 설치, 설정, 그리고 실제 거래 방법을 안내 맞춤형 세트 파일: 인디케이터를 빠르게 자동 설정하여 최고의 성과를 낼 수 있도록 도와줍니다 다른 전략은 이제 잊어버리세요! Grabber만이 여러분을 새로운 트레이딩의 정점으로 이끌어 줄 수 있습니다. Grabber 전략의 주요 특징: 거래 시간 프레임: M5부터 H4까지 거래 가능한 자산: 어떤 자산이든 사용 가능하지만, 제가 직접 테스트한 종목들을 추천드립니다 (GBPUSD, GBPCAD, GBPCHF, AUDCAD, AU
Bill Williams Advanced
Siarhei Vashchylka
5 (11)
Bill Williams Advanced is designed for automatic chart analysis using Bill Williams' "Profitunity" system. The indicator analyzes four timeframes at once. Manual (Be sure to read before purchasing) Advantages 1. Analyzes the chart using Bill Williams' "Profitunity" system. Signals are displayed in a table in the corner of the screen and on the price chart. 2. Finds all known AO and AC signals, as well as zone signals. Equipped with a trend filter based on the Alligator. 3. Finds "Divergence Bar
Btmm state engine pro
Garry James Goodchild
5 (4)
BTMM State Engine Pro is a MetaTrader 5 indicator for traders who use the Beat The Market Maker approach: Asian session context, kill zone timing, level progression, peak formation detection, and a multi-pair scanner from a single chart. It combines cycle state logic with a built-in scanner dashboard so you do not need the same tool on many charts at once. What it does Draws the Asian session range; session times can follow broker server offset or be set in inputs. Tracks level progression (L
SignalTech MT5
Yue Wang
5 (2)
SignalTech MT5 is a trading system for EURUSD, USDCHF, USDJPY, AUDUSD, NZDUSD, EURJPY, AUDJPY, NZDJPY, CADJPY H2 and H3 Timeframe.  It can generate signals with Buy/Sell Arrows and Pop-Up/Sound Alerts. Each signal has clear Entry and Stop Loss levels, which should be automatically flagged on the chart, as well as potential Targets 1, 2, and 3. The Entry and TP levels are fixed after the trade is taken. The exit level is dynamic. If there are signs of a potential short-term trend reversal, the
Berma Bands
Muhammad Elbermawi
5 (8)
Berma Bands(BBs) 지표는 시장 동향을 파악하고 이를 활용하려는 트레이더에게 귀중한 도구입니다. 가격과 BBs 간의 관계를 분석함으로써 트레이더는 시장이 추세 단계인지 범위 단계인지를 분별할 수 있습니다. 자세한 내용을 알아보려면 [ Berma Home Blog ]를 방문하세요. 버마 밴드는 세 개의 뚜렷한 선으로 구성되어 있습니다. 어퍼 버마 밴드, 미들 버마 밴드, 로어 버마 밴드입니다. 이 선들은 가격 주위에 그려져 전체 추세에 대한 가격 움직임을 시각적으로 표현합니다. 이 밴드들 사이의 거리는 변동성과 잠재적인 추세 반전에 대한 통찰력을 제공할 수 있습니다. 버마 밴드 라인이 각각에서 분리될 때, 그것은 종종 시장이 횡보 또는 범위 이동 기간에 접어들고 있음을 시사합니다. 이는 명확한 방향 편향이 없음을 나타냅니다. 트레이더는 이러한 기간 동안 추세를 파악하기 어려울 수 있으며 더 명확한 추세가 나타날 때까지 기다릴 수 있습니다. 버마 밴드 라인이 단일 라인으로
ARICoins
Temirlan Kdyrkhan
ARICoin is a powerful trading companion designed to generate high-probability entry signals with dynamic TP/SL/DP levels based on volatility. Built-in performance tracking shows win/loss stats, PP1/PP2 hits, and success rates all updated live. Key Features: Buy/Sell signals with adaptive volatility bands Real-time TP/SL/DP levels based on ATR Built-in MA Filter with optional ATR/StdDev volatility Performance stats panel (Success, Profit/Loss, PP1/PP2) Alerts via popup, sound, push, or email Cust
Volume flow Profile
Israr Hussain Shah
Master Edition은 거래량과 자금 흐름의 관점을 통해 시장 구조를 시각화하도록 설계된 전문가급 분석 도구입니다. 표준 거래량 지표와 달리, 이 도구는 차트에 일일 거래량 프로필을 직접 표시하여 가격 발견이 발생한 위치와 "스마트 머니"가 위치한 곳을 정확하게 볼 수 있게 합니다. 이 Master Edition은 명확성과 속도를 위해 설계되었으며, 로드 시 차트 레이아웃을 즉시 아름답게 만드는 독특한 자동 테마 동기화 시스템을 특징으로 합니다. 주요 기능: 진정한 자금 흐름 계산: 표준 틱 거래량을 넘어섭니다. "Use Money Flow"를 활성화하면 거래량이 가격에 따라 가중치가 부여되어 특정 가격 수준에서의 실제 자본 투입을 드러냅니다. 가치 영역(VA) 시각화: 가치 영역(기본값: 거래량의 70%)을 자동으로 계산합니다. VA Fill: 통제 구역을 즉시 식별하기 위해 가치 영역 배경을 음영 처리합니다. 주요 수준: 통제점(POC), 가치 영역 고점(VAH), 가치 영
Gartley Hunter Multi
Siarhei Vashchylka
5 (11)
Gartley Hunter Multi - An indicator for searching for harmonic patterns simultaneously on dozens of trading instruments and on all possible timeframes. Manual (Be sure to read before purchasing) | Version for MT4 Advantages 1. Patterns: Gartley, Butterfly, Shark, Crab. Bat, Alternate Bat, Deep Crab, Cypher 2. Simultaneous search for patterns on dozens of trading instruments and on all possible timeframes 3. Search for patterns of all possible sizes. From the smallest to the largest 4. All fou
RelicusRoad Pro MT5
Relicus LLC
5 (24)
RelicusRoad Pro: 퀀트 시장 운영 체제 70% 할인 평생 이용권 (한정 시간) - 2,000명 이상의 트레이더와 함께하세요 왜 대부분의 트레이더는 "완벽한" 지표를 가지고도 실패할까요? 진공 상태에서 단일 개념 만으로 거래하기 때문입니다. 문맥 없는 신호는 도박입니다. 지속적인 승리를 위해서는 컨플루언스(중첩) 가 필요합니다. RelicusRoad Pro는 단순한 화살표 지표가 아닙니다. 완전한 퀀트 시장 생태계 입니다. 독점적인 변동성 모델링을 사용하여 가격이 이동하는 "공정 가치 로드"를 매핑하고, 단순 노이즈와 실제 구조적 돌파를 구분합니다. 추측은 그만두세요. 기관급 로드 로직으로 거래를 시작하세요. 핵심 엔진: "Road" 알고리즘 시스템의 중심에는 시장 상황에 실시간으로 적응하는 동적 변동성 채널인 Road Algo 가 있습니다. 세이프 라인(평형) 과 가격이 수학적으로 반전될 가능성이 높은 확장 레벨 을 투영합니다. Simple Road: 일반적인 시장을 위
우선적으로, 이 거래 도구는 전문적인 거래에 이상적인 비-다시 그리기 및 지연되지 않는 지표입니다.  온라인 강좌, 사용자 매뉴얼 및 데모. 스마트 가격 액션 컨셉트 인디케이터는 신규 및 경험 많은 트레이더 모두에게 매우 강력한 도구입니다. Inner Circle Trader Analysis 및 Smart Money Concepts Trading Strategies와 같은 고급 거래 아이디어를 결합하여 20가지 이상의 유용한 지표를 하나로 결합합니다. 이 인디케이터는 스마트 머니 컨셉트에 중점을 두어 대형 기관의 거래 방식을 제공하고 이동을 예측하는 데 도움을 줍니다.  특히 유동성 분석에 뛰어나 기관이 어떻게 거래하는지 이해하는 데 도움을 줍니다. 시장 트렌드를 예측하고 가격 변동을 신중하게 분석하는 데 탁월합니다. 귀하의 거래를 기관 전략에 맞추어 시장의 동향에 대해 더 정확한 예측을 할 수 있습니다. 이 인디케이터는 시장 구조를 분석하고 중요한 주문 블록을 식별하고 다양
Weltrade Spike Sentinel
Batsirayi L Marango
5 (1)
Introducing Indicator for PainX and GainX Indices Traders on Weltrade Get ready to experience the power of trading with our indicator, specifically designed for Weltrade   broker's PainX and GainX Indices.  Advanced Strategies for Unbeatable Insights Our indicator employs sophisticated strategies to analyze market trends, pinpointing optimal entry and exit points.  Optimized for Maximum Performance To ensure optimal results, our indicator is carefully calibrated for 5-minute timeframe charts on
" Dynamic Scalper System MT5 " 지표는 추세 파동 내에서 스캘핑 방식으로 거래하도록 설계되었습니다. 주요 통화쌍 및 금에서 테스트되었으며, 다른 거래 상품과의 호환성이 가능합니다. 추가적인 가격 변동 지원을 통해 추세에 따라 단기 포지션 진입 신호를 제공합니다. 지표의 원리 큰 화살표는 추세 방향을 결정합니다. 작은 화살표 형태의 스캘핑 신호를 생성하는 알고리즘은 추세 파동 내에서 작동합니다. 빨간색 화살표는 상승 방향을, 파란색 화살표는 하락 방향을 나타냅니다. 민감한 가격 변동선은 추세 방향으로 그려지며, 작은 화살표의 신호와 함께 작용합니다. 신호는 다음과 같이 작동합니다. 적절한 시점에 선이 나타나면 진입 신호가 형성되고, 선이 있는 동안 미결제 포지션을 유지하며, 완료되면 거래를 종료합니다. 권장되는 작업 시간대는 M1~H4입니다. 화살표는 현재 캔들에 형성되며, 다음 캔들이 이미 시작되었더라도 이전 캔들의 화살표는 다시 그려지지 않습니다. 입
RFI levels PRO MT5
Roman Podpora
3.67 (3)
이 지표는 추세 반전 지점과 가격 반등 영역을 정확하게 보여줍니다.       주요 투자자들   . 새로운 트렌드가 형성되는 곳을 파악하고 최대한 정확하게 의사결정을 내리며 모든 거래를 완벽하게 통제합니다. TREND LINES PRO   지표와 함께 사용할 때 최대의 잠재력을 발휘합니다.  VERSION MT4 지표가 보여주는 내용: 새로운 추세의 시작 시 활성화되는 반전 구조 및 반전 수준. 최소한의 위험 대비 수익률을 갖는 이익 실현   (TAKE PROFIT)   및   손절매(STOP LOSS)   레벨 표시       RR 1:2   . 지능형 손실 감소 로직이 적용된 손절매 기능. 지정된 지표에서 두 가지 추세 유형에 대한 반전 패턴을 표시합니다. 지표: 트렌드를 따라   트렌드 라인 프로   (글로벌 트렌드 변화) 트렌드 프로   (빠른 트렌드 변화) 간단하고 효과적입니다       스캐너       실시간 추세 (신규). 다중 시간 프레임 도구 필터링. 표시하다  
AriX
Temirlan Kdyrkhan
1 (4)
AriX Indicator for MT5 A powerful trend-following and signal-evaluation tool AriX is a custom MT5 indicator that combines Moving Averages and ATR-based risk/reward logic to generate clear buy/sell signals. It visualizes dynamic SL/TP levels, evaluates past trade outcomes, and displays win/loss statistics in a clean on-chart panel. Key features include: Buy/Sell signals based on MA crossovers ATR-based SL/TP1/TP2/TP3 levels with visual lines and labels Signal outcome tracking with real-time stat
Smart Structure Concepts MT5
Cristhian Alexander Gaibor Cuasquer
Smart Structure Concepts MT5는 MetaTrader 5를 위한 가장 완전한 기관급 SMC 툴킷입니다 — 4개 언어의 교육용 툴팁과 가격이 존에 진입하는 순간 발생하는 실시간 푸시 알림을 갖추고 있습니다. 대부분의 SMC 인디케이터는 박스만 그리고 나머지는 추측에 맡깁니다. 이 인디케이터는 차트 위에서 모든 시그널을 직접 설명합니다. 모든 BOS, CHoCH, Order Block, FVG, 유동성 레벨 위에 마우스를 올리면 의미와 다음 조치를 즉시 확인할 수 있습니다 — 영어, 스페인어, 포르투갈어, 프랑스어로. 주요 기능 — Internal & Swing BOS / CHoCH 실시간 감지 (리페인트 없음) — Internal & Swing Order Blocks 자동 미티게이션 — 상승 및 하락 Fair Value Gaps — Equal Highs & Lows (EQH / EQL) 유동성 매핑 — Premium / Discount / Equilibrium
Ziva LSE System
Hassan Abdullah Hassan Al Balushi
ZIVA LSE System A Professional Liquidity & Structure Execution Framework Executive Overview ZIVA LSE System is a professionally engineered analytical framework designed to interpret market behavior through structural logic and liquidity dynamics. It is not positioned as a conventional indicator. Rather, it functions as a structured execution environment that organizes price action into a clear, disciplined decision-making model. The system is built to deliver consistency, clarity, and controlle
Omniview ICT Dashboard
Kayode Michael Oyetunde
기관의 흐름을 마스터하십시오. 시장을 지배하십시오. "A+" 셋업을 찾으려면 편향(Bias), 유동성(Liquidity), 변위(Displacement)라는 세 가지가 필요합니다. 대부분의 트레이더는 낮은 시간대의 노이즈에서 길을 잃거나 가짜 움직임에 속아 어려움을 겪습니다. OmniView ICT 대시보드는 여러분의 기관용 렌즈입니다. 종합 시세(Market Watch) 전체를 스캔하여 중요한 시장 활동이 일어나는 지점을 강조해 주므로, 더 이상 거래를 찾아 헤맬 필요 없이 정밀하게 실행할 수 있습니다. ️ 중요: 데모 테스트 전 필독 MetaTrader 5 전략 테스터의 기술적 제한으로 인해, 백테스트 모드에서는 다중 통화 스캔 기능을 온전히 평가할 수 없습니다. 모든 기능을 경험하려면 라이브 또는 데모 차트에서 지표를 실행하십시오. 이를 통해 여러 심볼을 동시에 스캔하고 원클릭 차트 동기화(One-Click Chart Sync)와 같은 기능을 사용할 수 있습니다. 스코어링 엔
ZIVA Signal Intelligence
Hassan Abdullah Hassan Al Balushi
ZIVA Signal Intelligence An Adaptive, Modular Market Intelligence System ZIVA Signal Intelligence is not positioned as a conventional trading indicator. It is a fully integrated, proprietary market intelligence system engineered to deliver structured, high-precision interpretation of price behavior within a controlled analytical environment. Developed through an independent architectural approach, ZIVA does not rely on, derive from, or replicate existing indicators. It represents a standalone
PZ Swing Trading MT5
PZ TRADING SLU
5 (5)
Protect against whipsaws: revolutionize your swing trading approach Swing Trading is the first indicator designed to detect swings in the direction of the trend and possible reversal swings. It uses the baseline swing trading approach, widely described in trading literature. The indicator studies several price and time vectors to track the aggregate trend direction and detects situations in which the market is oversold or overbought and ready to correct. [ Installation Guide | Update Guide | Tro
Advanced Supply Demand MT5
Bernhard Schweigert
4.53 (15)
현재 33% 할인! 초보자나 전문 트레이더를 위한 최고의 솔루션! 이 보조지표는 우리가 다수의 독창적 기능과 새로운 공식을 통합한 독특하고 고품질이며 저렴한 거래 도구입니다. 이 업데이트를 통해 이중 시간대를 표시할 수 있습니다. 더 높은 TF를 표시할 수 있을 뿐만 아니라 차트 TF와 더 높은 TF 모두를 표시할 수 있습니다: 중첩 영역 표시. 모든 Supply Demand 트레이더들이 좋아할 것입니다. :) 중요한 정보 공개 Advanced Supply Demand의 잠재력을 극대화하려면 다음을 방문하십시오. https://www.mql5.com/ko/blogs/post/720245   진입 또는 목표의 명확한 트리거 포인트를 정확히 찾아냄으로 해서 거래가 어떻게 개선될지 상상해 보십시오. 새로운 알고리즘을 기반으로 매수자와 매도자 간의 잠재적인 불균형을 훨씬 더 쉽게 분간할 수 있습니다. 왜냐하면 가장 강한 공급영역과 가장 강한 수요 영역과 과거에 어떻게 진행 되었는지를(이전
Premium level Pro
Dmitriy Kashevich
Premium level is a unique indicator with more than 80% accuracy of correct predictions! This indicator has been tested for more than two months by the best Trading Specialists! The author's indicator you will not find anywhere else! From the screenshots you can see for yourself the accuracy of this tool! 1 is great for trading binary options with an expiration time of 1 candle. 2 works on all currency pairs, stocks, commodities, cryptocurrencies Instructions: As soon as the red arrow app
Volatility Trend System - a trading system that gives signals for entries. The volatility system gives linear and point signals in the direction of the trend, as well as signals to exit it, without redrawing and delays. The trend indicator monitors the direction of the medium-term trend, shows the direction and its change. The signal indicator is based on changes in volatility and shows market entries. The indicator is equipped with several types of alerts. Can be applied to various trading ins
IVISTscalp5
Vadym Zhukovskyi
5 (6)
iVISTscalp5 — 시간 기반 시장 예측 시스템 iVISTscalp5는 일반적인 지표가 아닙니다. MetaTrader 5용 시간 기반 예측 시스템으로, 시장이 언제 움직일 가능성이 높은지를 보여줍니다. ⸻ 기능  • 정확한 타이밍  • BUY / SELL 신호  • 평균 수익 잠재력  • 주간 예측  • 120개 이상의 자산 ⸻ 핵심 개념 시장은 가격뿐만 아니라 시간에 의해 움직인다 ⸻ iVISTscalp5 — 시간에서의 우위 당신에게 소개하는 iVISTscalp5 지표는 독특하면서도 거래 작업에서 효과적입니다. 이 지표는 시간 데이터를 기반으로 하며 금융 시장의 많은 경험과 깊은 분석의 결과입니다. iVISTscalp5 지표는 수동 거래에 뛰어난 도구입니다. 편리성, 간단함 및 시각화 - 모든 복잡성은 숨겨져 있습니다. 우리는 iVISTscalp5 지표의 설정과 사용을 최대한 단순화했습니다. 이 지표는 MT5 터미널에서 가지고 있는 모든 금융 상품에 적합
Trend Forecaster
Alexey Minkov
5 (7)
Trend Forecaster – Since 2023. The Trend Forecaster indicator utilizes a unique proprietary algorithm to determine entry points for a breakout trading strategy. The indicator identifies price clusters, analyzes price movement near levels, and provides a signal when the price breaks through a level. The Trend Forecaster indicator is suitable for all financial assets, including currencies (Forex), metals, stocks, indices, and cryptocurrencies. You can also adjust the indicator to work on any time
제작자의 제품 더 보기
Pro15
Jason Smith
It's recommended that you read through the entire document.. Pro15 is a professional breakout Expert Advisor built around clearly defined daily price structure. The EA continuously calculates and plots the current day’s high, low, open, and multiple intraday equilibrium levels directly on the chart, then executes trades when price breaks these levels according to your selected confirmation rules. This Trading bot is designed so the same engine can be run side by side as both a trend-following an
Synthetic Timeframe Creator Professional Custom Timeframe Visualization for MetaTrader 5 Revolutionize your multi-timeframe analysis with Synthetic Timeframe Creator. Tired of switching between charts? Need to analyze specific time cycles that don't exist in standard timeframes?  This is your ultimate solution. Create custom D2, D3, W2, W3 (or any N-period) candles directly on your MT5 chart without needing custom symbols or complex workarounds. KEY FEATURES Flexible Timeframe Synthesis Choos
FREE
Automatically Close Trades at Your Desired Profit Target! Take the guesswork out of trading by automatically closing your positions as soon as they reach your set profit target. Add to any chart-  The Bot will monitor all open trades Key Features:     Automatic Trade Closing:     Set a profit target in USD, and let FinalStrike automatically close the trade when dollar amount is achieved     Multiple Positions Supported:     Whether you have one or multiple trades open across different pairs,
FREE
Welcome to the Williams Percent Range EA (wpr)           It's recommended that you read through the document before you start creating a strategy.         Risk management  — Fixed and risk-based position sizing for flexible risk management.        Features:  ATR For Stop Loss And Take Profit. Position Size. Fixed Or Risk Based Risk Based. Equity, Balance Or Free Margin Stop Loss Mode. Closes trade on signal and enters new trade opposite direction. (close of candle) Limit Trading Hours
It's recommended that you read through the entire document. For the first time ever on MQL5 . A first of its kind on the marketplace. Introducing a truly groundbreaking trading bot—one that combines ATR-driven risk management with an innovative daily percentage change trading strategy. Designed for trading a wide range of assets, including Gold, Oil, Bitcoin, Forex and Indices . (Ideal for basket trading.) This powerful, fully automated exclusive Bot is designed to give traders a unique edge
Mfi ATR EA
Jason Smith
Money Flow Index. MFI EA Atomated Trading Bot MFI bots can be valuable tools for automating trading s trategies based on market momentum. However, it's crucial to understand their functionality, monitor their performance, and use them as part of a comprehensive trading plan. The Money Flow Index (MFI) is a technical analysis tool that combines price and volume to assess the buying and selling pressure of an asset. In cryptocurrency trading, MFI bots utilize this indicator to automate trading d
Moving Averages Bot with ATR – A Comprehensive Trading Tool .     Very RARE POWERFUL AND UNIQUE moving averages BOT that incorporates ATR with Stop Loss, Take Profit Multiplier. Multiple Time Frames and a lot more.     This Bot is an impressive automated trading system that combines the simplicity of moving averages with the dynamic adaptability of the Average True Range (ATR).     Designed to enhance trading strategies by offering a balanced mix of trend-following techniques and risk manag
RandomPulse ATR Driven Directionless Bot" Expert Advisor! What Does this bot Do? The  EA is designed to execute trades based on a random entry, ensuring that your trading positions are always dynamic and engaging. Here's what it offers!     Random Trade Direction:     This EA randomly selects whether to buy or sell, ensuring that your trading strategy isn't limited by predictable patterns.     Buy or Sell:       The Bot will Randomly Choose     Customizable Stop Loss and Take Profit:     Bas
Gold Trading Made Simple – Maximize Profits With This Proven Strategy! Silent Syndicate – The Ultimate AI-Powered Gold Trading Bot. Precision. Performance. Profitability. Gold trading is a highly lucrative market , but without the right strategy, it can be volatile and unpredictable. Silent Syndicate is a state-of-the-art trading system designed to maximize profits, minimize risk, and provide consistent long-term returns. Powered by intelligent algorithms, strategic trade management, and advan
Introducing TriggerGuard Pending Order EA This Bot is a state-of-the-art, fully automated Expert Advisor  Utilizing a robust pending order system, TriggerGuard ensures that your trades are placed and executed only when market conditions align with your preset criteria. A very useful transferable tool for price action strategies, allowing you to effortlessly set traps in the market. It works flawlessly. You can execute the bot during corrections in a descending channel, against impulse waves, or
The Midnight Thottle Expert Advisor: Automated Trading Based on Alignment of Percentages The Midnight Throttle EA is an expert advisor that trades automatically based on the alignment of four key timeframes' percentage changes. It trades what Midnight Watch visualizes." It uses the Midnight Watch indicator’s data to analyze market conditions and enter trades when the market shows significant alignment across different timeframes. How Midnight Throttle Works: Alignment Criteria: The Expert
I am a trader specializing in the development of rare , exclusive , high-performance trading bots designed for serious traders who are committed to achieving consistent profitability and success. This free indicator is more than just a visual tool—it powers the Midnight Throttle EA , an automated trading system that executes trades based on the precise market conditions this indicator observes. Midnight Watch : A Pro-Level Tool for Precision Market Analysis. An advanced , multi-functional MetaTr
It's recommended that you read through the entire document. Sentinal Core– A Multi-Timeframe Percentage Threshold Logic Engine Exclusive to MQL5  Sentinal Core is the third and final Expert Advisor in a trilogy of EA's engineered for directional alignment using percentage-based trend analysis. It is not your typical entry-signal bot. Sentinel Core is a pure logic engine designed to rigorously filter signal validity through real-time, multi-timeframe sentiment analysis based solely on price act
BreakPoint Pro – Daily High/Low Breakout EA This bot is a professional-grade Expert Advisor that trades breakouts of the current day's high and low using a clean, rules-based price action approach. The strategy focuses on capturing directional momentum once price breaches these key intraday levels—one of the most statistically reliable patterns in discretionary and algorithmic trading. A powerful Expert Advisor designed to capitalize on daily high/low breakouts using a price action-driven strat
Globex Range Levels – Gold Edition Market Focus: XAUUSD / Gold / Futures-style Assets m5-m15 Designed For: Day Traders, Scalpers, Institutional-Level Strategies What is Globex Globex is the electronic trading platform operated by CME Group, enabling nearly 24-hour trading of futures and options across global markets. It runs outside traditional U.S. trading hours and is commonly referred to as the overnight session . In trading, the term "Globex session" typically refers to the period between th
Global Risk Manager Auto Stop Loss  Automate Your Risk Management This utility works seamlessly with any symbol, by intelligently setting your initial Stop Loss and Take Profit the instant a new position is opened. Perfect for traders who enter manually or via an EA  but want consistent, rules-based risk management applied automatically. Why You Need This Eliminates Human Error: Never forget to set a stop loss again. Ensures every trade is protected from the start. Enforces Discipline: Removes
This Expert Advisor combines classic mean reversion with an advanced Bollinger Band Walk Filter to trade when momentum is confirmed. It can be adapted between mean reversion and a breakout strategy (Bollinger walk), reducing false signals and improving trade precision. The Walk Filter detects sustained price interaction with Bollinger Bands over N consecutive bars. Only after this walk is confirmed does the EA enable breakout trades in the corresponding direction. Upper band walks trigger breako
Session Map Pro automatically plots the critical price levels from previous trading days and overlays visual session markers, giving you an instant "roadmap" of potential support and resistance.   It transforms your chart into a strategic trading battlefield.   Detailed Line Reference Guide (For visual display m1-m5 works best but can be attached to any time frame) Default lookbackDays=5. "Set to 1 for today only and a less cluttered display"  1.Horizontal lines (n) Days)    Solid GREEN Line (
Magic History is a detailed trade visualization indicator designed to bring the full story of your trading activity directly onto the chart. If you’re a developer or trader who uses magic numbers, this is made for you. Smart pagination - never lose track of your trades again Pagination means dividing content into separate pages instead of showing everything all at once. In the context of your Magic History indicator: Pagination is a system that lets you view your trades in sections (pages) — fo
Ping-Monitor — Never Miss a Tick Again! Do you run EAs and worry about silent chart freezes or data feed stalls ?  This utility is your ultimate watchdog, alerting you the moment your charts stop receiving updates. Ping-Monitor is designed to detect when a chart freezes or the data feed stalls, even if MT5 still shows that the connection is active. It works by tracking the time of the last incoming tick. Every time the chart receives a new price update, the EA records the timestamp. Then, on a
Support and Resistance Pro - Professional Trading Tool Professional Daily Price Structure Analysis with Intelligent Notifications A comprehensive trading tool that transforms your chart into an organized workspace by visually mapping the market's daily price structure while keeping you informed of critical price interactions through a sophisticated alert system. Trading key levels that form clusters of confluence is about identifying price areas where multiple independent factors line up, rath
필터:
리뷰 없음
리뷰 답변