Correct Entry mt5
- Indicadores
- Alexey Surkov
- Versión: 21.111
- Actualizado: 20 noviembre 2021
- Activaciones: 20
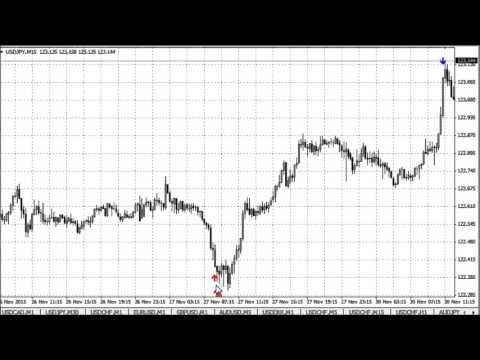
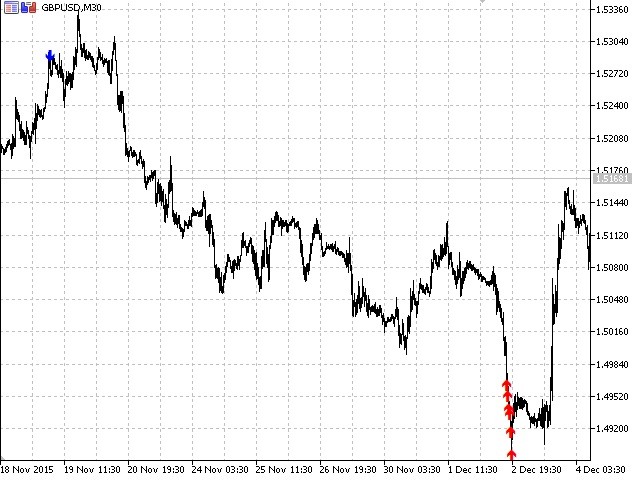
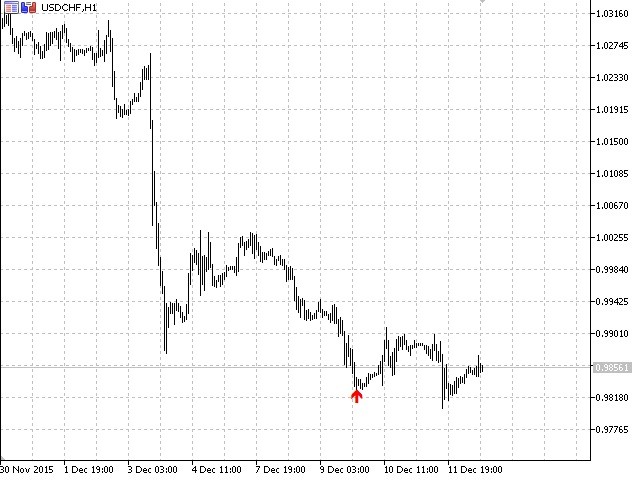
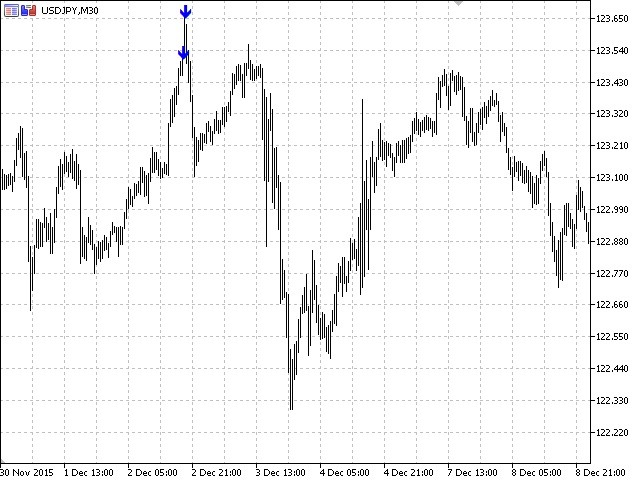
El indicador Entrada Correcta muestra en el gráfico puntos específicos relativamente correctos de posibles entradas en el mercado. Se basa en la hipótesis de la no linealidad de los movimientos de precios, según la cual el precio se mueve en ondas. El indicador muestra los puntos especificados basándose en determinados modelos de movimiento de precios y datos técnicos.
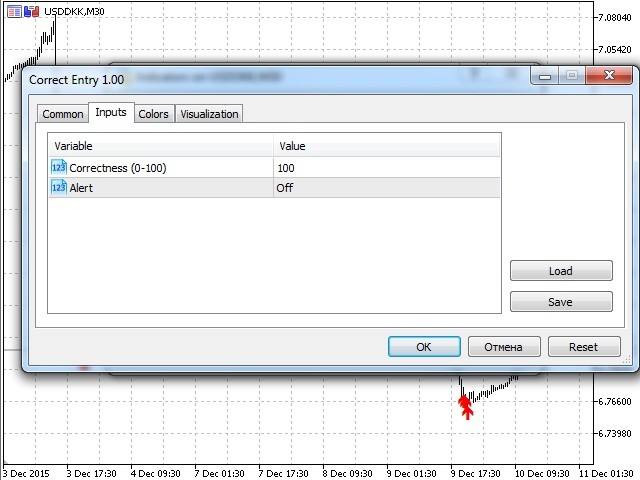
Parámetros de entrada del indicador:
- Сorrección - El parámetro caracteriza el grado de exactitud de las señales de entrada. Puede variar de 0 a 100. El valor predeterminado es 100. La exactitud de las señales disminuye con la disminución del parámetro, pero su número va en aumento.
- Alerta - puede establecer una alerta cuando aparece una señal. On - mostrar alerta, Off - sin alerta. El valor por defecto es Falso.
Para obtener puntos de entrada correctos recomendamos lo siguiente:
- Ajuste los parámetros para cada par negociado y marco de tiempo;
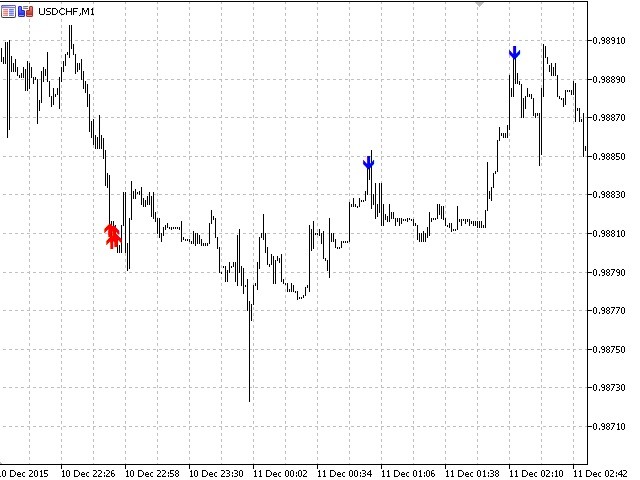
- Primero, obtenga una señal en un marco de tiempo superior (por ejemplo, H1), luego espere una señal similar en un marco de tiempo inferior (por ejemplo, M5).