Trend Trade mt5
- Indicadores
- Versión: 21.111
- Actualizado: 21 noviembre 2021
- Activaciones: 20

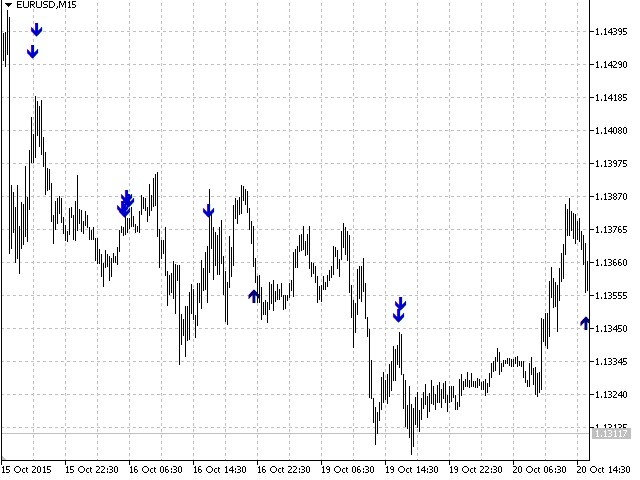
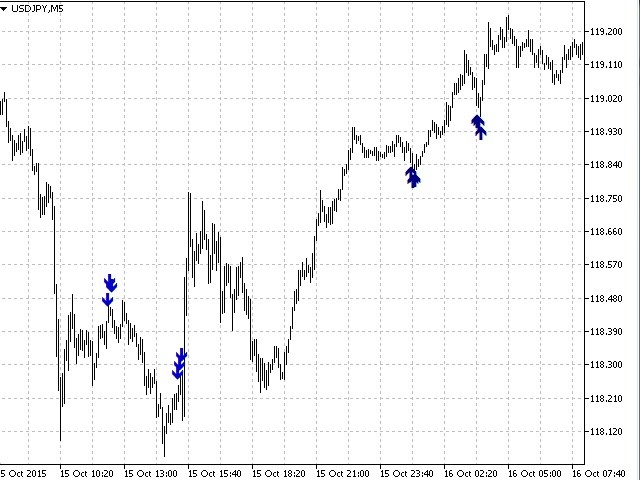
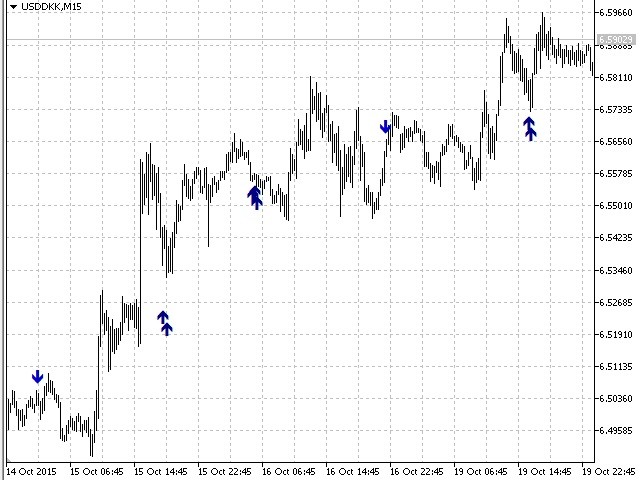
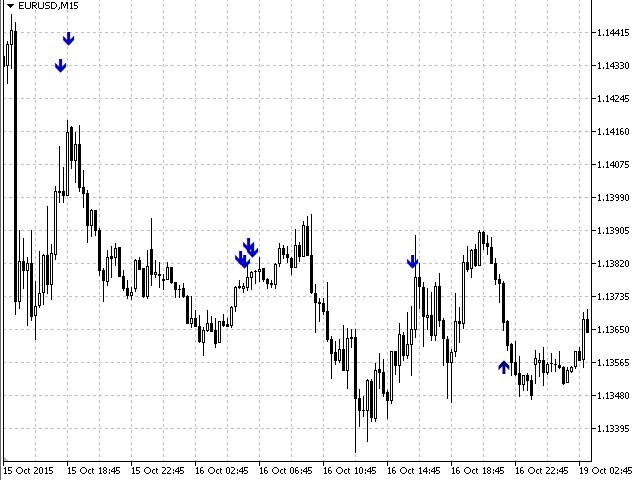
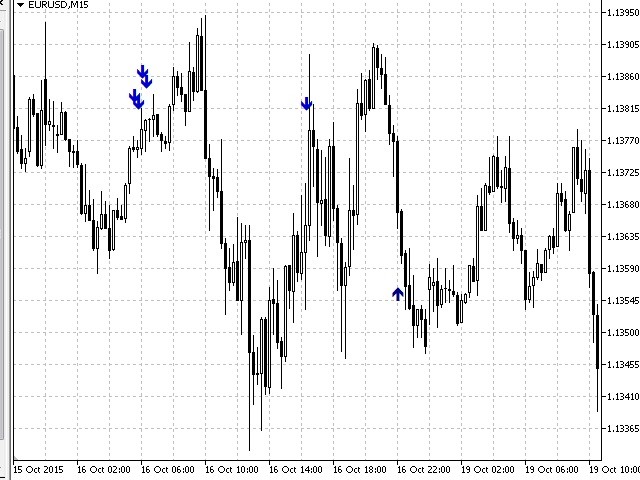
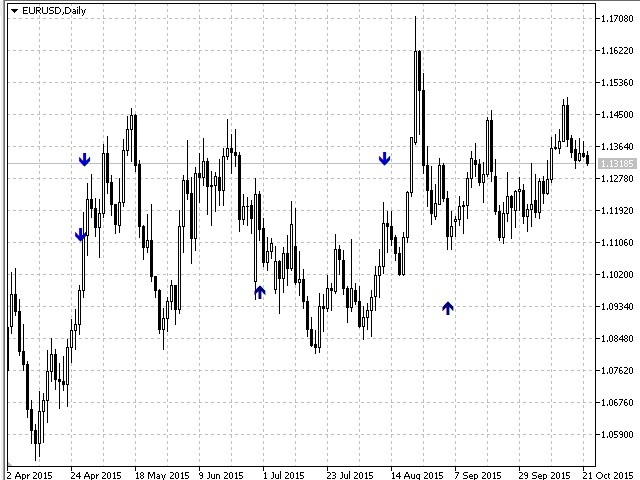
El indicador Trend Trade muestra los supuestos puntos de giro del precio en el gráfico en la dirección de la tendencia después de la corrección. Se basa en los datos del oscilador Prise Re versal con el período 6 y los indicadores que caracterizan la fuerza y la disponibilidad de la tendencia. Cuando el valor de Prise Reversal se encuentra en el área de sobrecompra o sobreventa (el tamaño del área es fijado por el usuario), y la tendencia actual se confirma, el indicador Trend Trade dibuja una flecha apuntando hacia el futuro movimiento del precio asumido.
Entradas
- PR - tamaño de las áreas de sobrecompra/sobreventa del indicador Prise Reversal. El valor por defecto es 25. Si disminuye este valor, el indicador Trend Trade generará menos señales, pero serán más precisas. Y viceversa si lo aumenta.
- Tendencia - porcentaje del cambio de precio en los últimos periodos. El valor por defecto es 0.03. El aumento del valor conduce a la disminución del número de señales, pero también significa que las señales se generarán en puntos con movimiento excepcionalmente agudo.
- Alerta - puede establecer una alerta cuando aparece una señal. Verdadero - mostrar alerta, Falso - sin alerta. El valor por defecto es Falso.
Para obtener puntos de entrada correctos, recomendamos lo siguiente:
- Ajuste los parámetros para cada par negociado y marco temporal;
- Primero, obtenga una señal en un marco de tiempo superior (por ejemplo, H1), luego espere una señal similar en un marco de tiempo inferior (por ejemplo, M15).