Correct Entry mt5
- 지표
- 버전: 21.111
- 업데이트됨: 20 11월 2021
- 활성화: 20

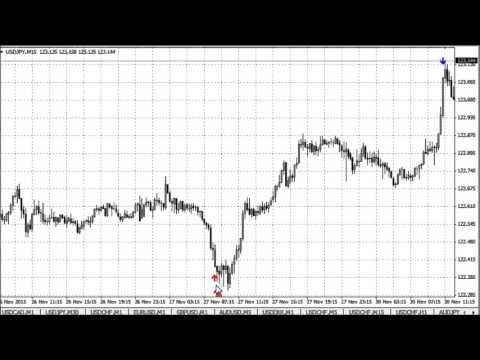
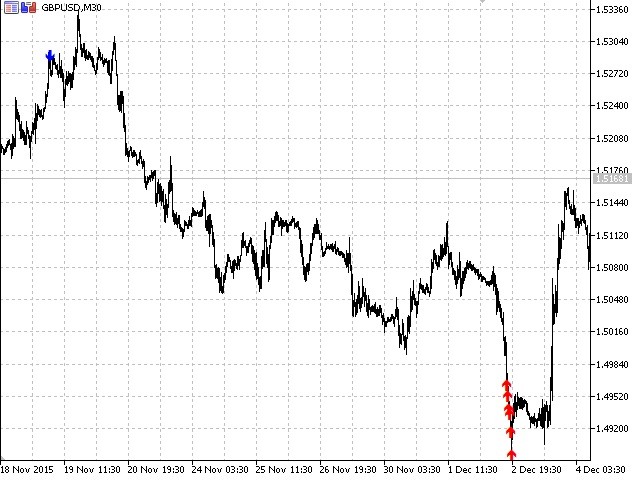
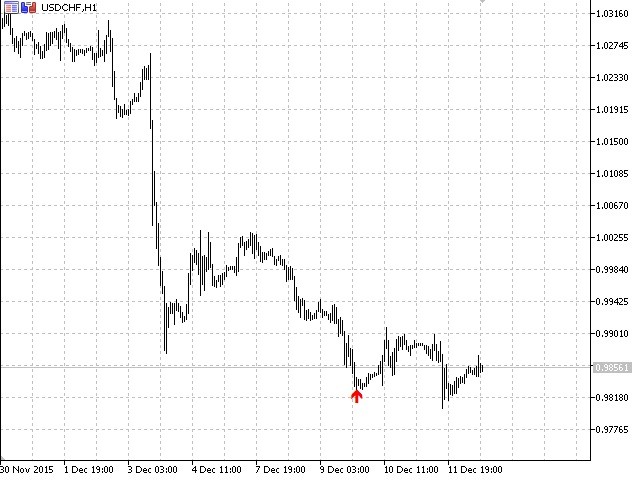
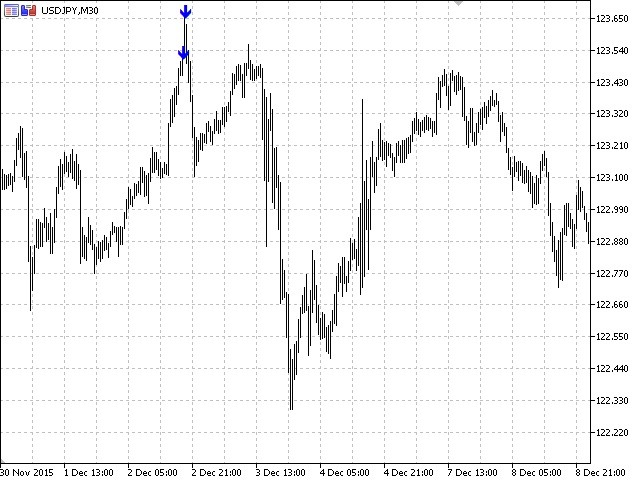
The Correct Entry indicator displays specific relatively correct points of potential market entries on the chart. It is based on the hypothesis of the non-linearity of price movements, according to which the price moves in waves. The indicator displays the specified points based on certain price movement models and technical data.
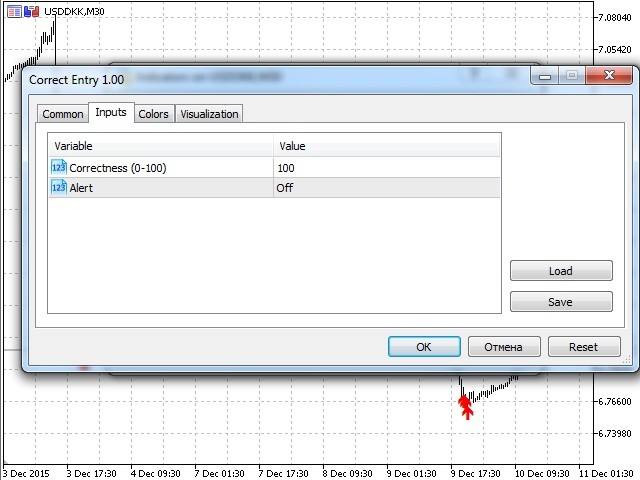
Indicator Input Parameters:
- Сorrectness – The parameter characterizes the degree of accuracy of the entry signals. Can vary from 0 to 100. The default is 100. Accuracy of signals decreases with the decrease of the parameter, but their numbers are increasing.
- Alert – you can set an alert when a signal appears. On – display alert, Off – no alert. Default value is False.
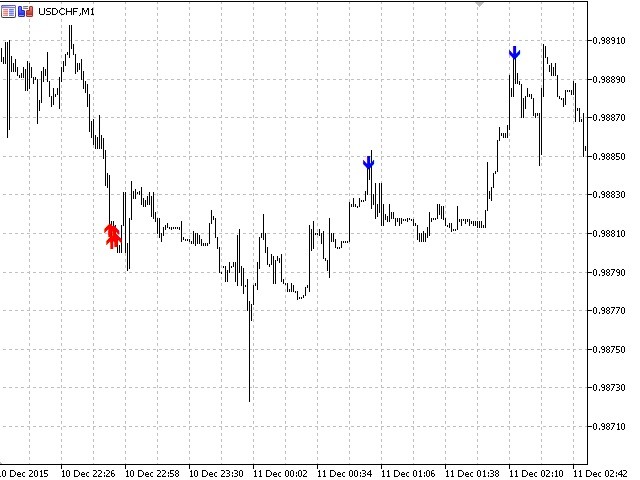
To get correct entry points we recommend the following:
- Adjust parameters for each traded pair and timeframe;
- First, get a signal on a higher timeframe (for example, H1), then wait for a similar signal on a lower timeframe (for example, M5).