Moving Ratio
- Indicadores
- Versión: 1.0
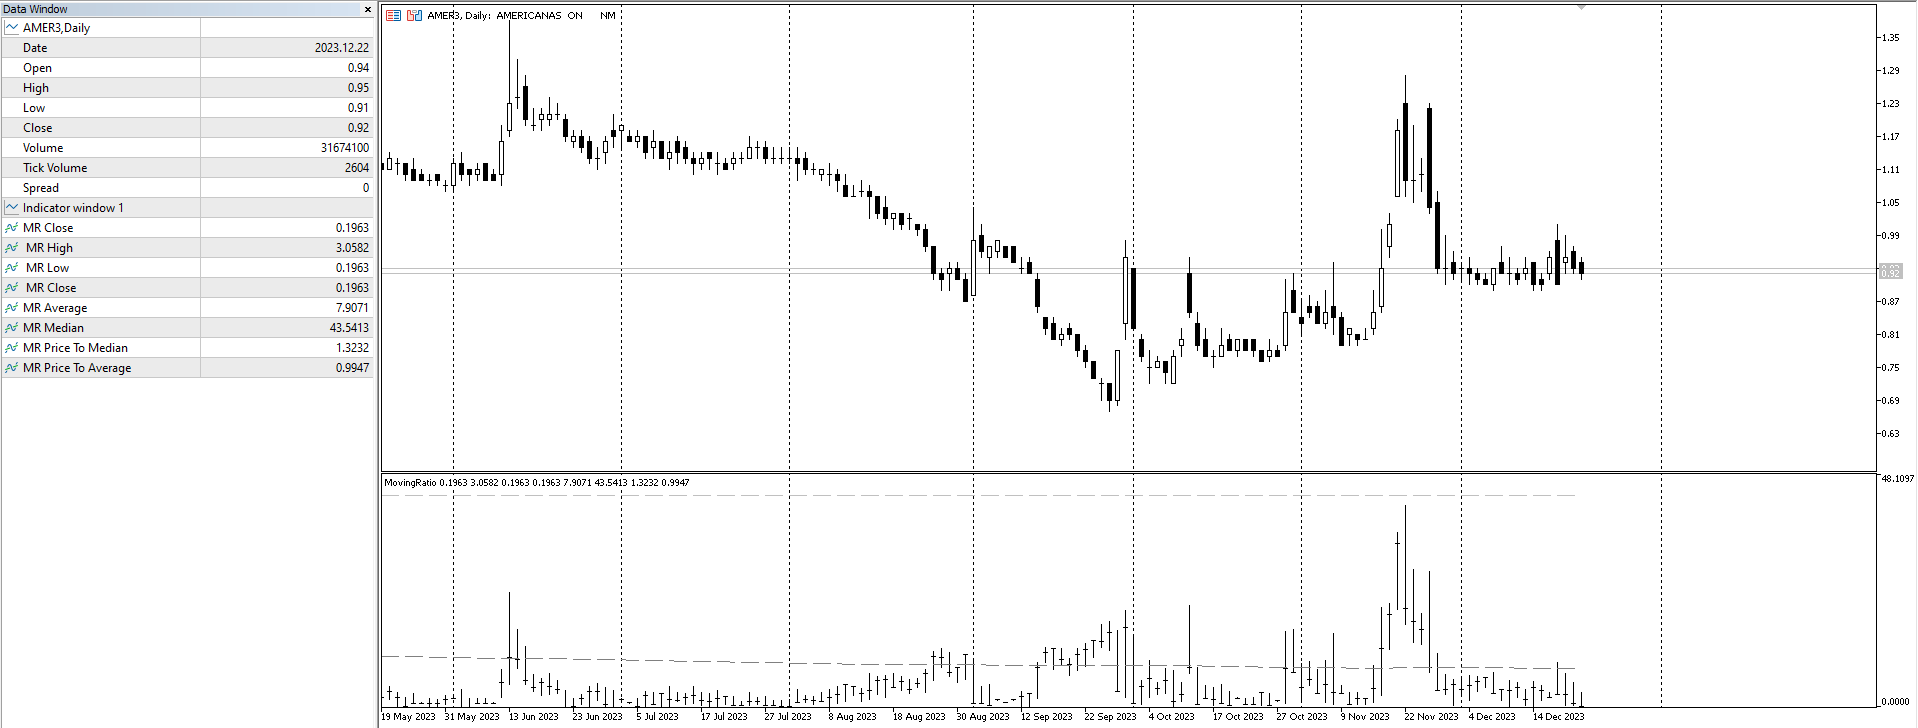
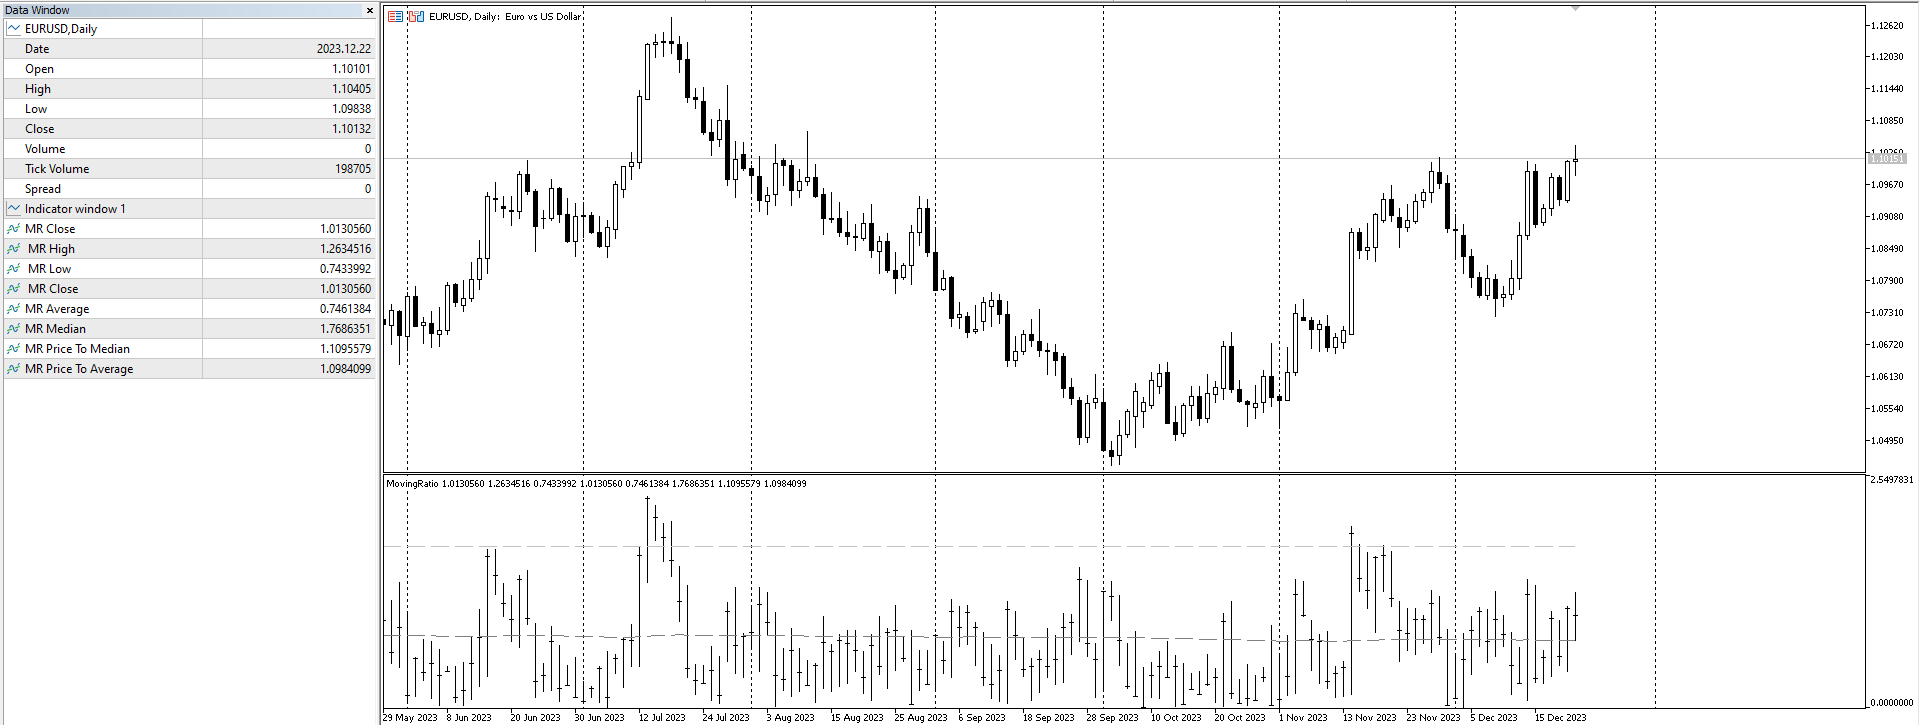
"Moving Ratio Candle" se utiliza para comprobar la distancia de una vela a un punto de presión teórico. Además, tenemos dos puntos de interés, el primero para la media y el segundo para la mediana. Este indicador utiliza la forma de las barras y la línea que cruza la barra de izquierda a derecha se basa en el cálculo del precio de cierre para ambos lados. El resto sigue un cálculo más estándar. Se podría hacer lo mismo como una línea, pero quiero saber el comportamiento de este indicador en relación a la vela de precio OHLC. Así que una simple línea no me lo diría.
En la parte de datos de la herramienta en orden: los datos de 4 barras - OHLC; la media (que puede ser influenciada por el factor de multiplicación); la mediana (no influenciada por el factor de multiplicación); el precio que debe ser alcanzado para golpear la mediana; finalmente, el valor que debe ser alcanzado para golpear la media.
Este indicador se redibuja y parpadea a veces ya que no puedo prestarle suficiente atención. Así que estoy haciendo una prueba poniéndolo en el mercado de forma gratuita.