Weiss Wave with Zigzag and several data
- Indicadores
- Versión: 2.0
- Actualizado: 16 octubre 2021
- Activaciones: 20
Weiss Wave con mucha funcionalidad y ligero. El mismo puede ser utilizado tanto en mercados que tienen acceso a volumen (REAL=Contratos, Tick=Negocios) o puntos!
Usted podrá:
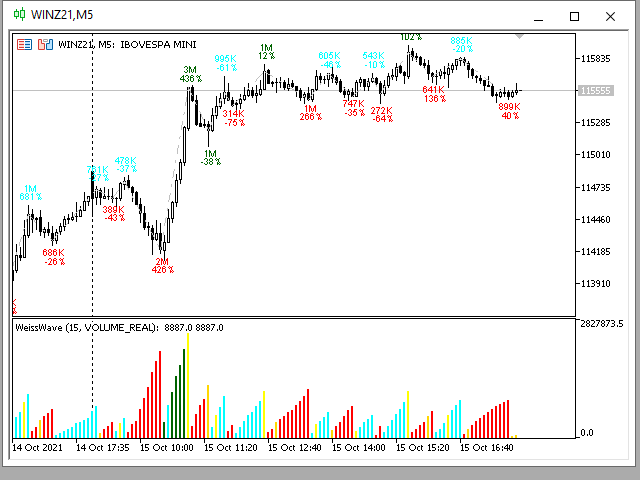
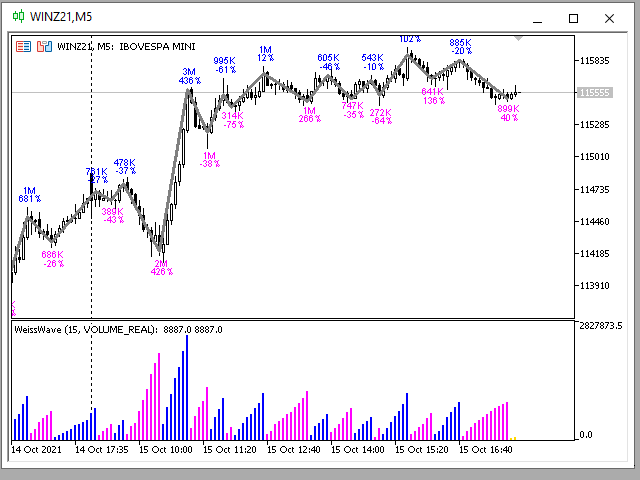
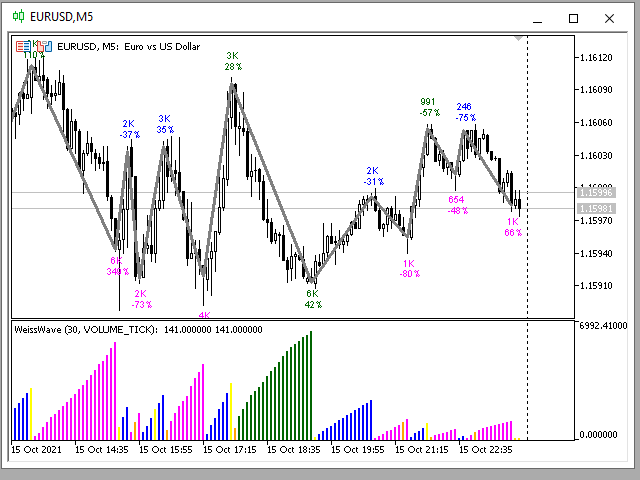
- ¡Analizar el volumen del mercado por swings realizados!
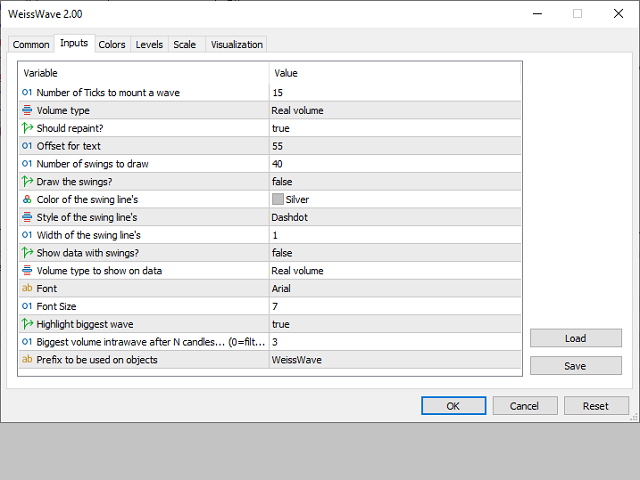
- ¡Definir la fuente de los datos presentados en el gráfico, su tamaño y color! ¡ O simplemente ocultar esta información!
- ¡Definir si mostrar o no los swings en el gráfico y cuántos swings! ¡Además de definir el color, grosor y estilo de la línea de tendencia!
Los datos que se muestran en el gráfico cuando está habilitado son:
- Volumen o puntos (según configuración);
- Porcentaje de crecimiento en relación a la onda anterior del mismo tipo;
- ¡Pontuación de la onda alcanzada de un cierre al siguiente!
Usted podrá:
- ¡Analizar el volumen del mercado por swings realizados!
- ¡Definir la fuente de los datos presentados en el gráfico, su tamaño y color! ¡ O simplemente ocultar esta información!
- ¡Definir si mostrar o no los swings en el gráfico y cuántos swings! ¡Además de definir el color, grosor y estilo de la línea de tendencia!
Los datos que se muestran en el gráfico cuando está habilitado son:
- Volumen o puntos (según configuración);
- Porcentaje de crecimiento en relación a la onda anterior del mismo tipo;
- ¡Pontuación de la onda alcanzada de un cierre al siguiente!