Pon "Me gusta" y sigue las noticias
Deje un enlace a él, ¡qué los demás también lo valoren!
Evalúe su trabajo en el terminal MetaTrader 5

RndTrade - Asesor Experto para MetaTrader 4

- Visualizaciones:
- 973
- Ranking:
- Publicado:
-
 Está perdiendo oportunidades comerciales:
- Aplicaciones de trading gratuitas
- 8 000+ señales para copiar
- Noticias económicas para analizar los mercados financieros
Registro EntradaUsted acepta la política del sitio web y las condiciones de uso
Si no tiene cuenta de usuario, regístrese -
 ¿Necesita un robot o indicador basado en este código? Solicítelo en la bolsa freelance
Pasar a la bolsa
¿Necesita un robot o indicador basado en este código? Solicítelo en la bolsa freelance
Pasar a la bolsa
La posición se abre cada cuatro horas. Para definir la dirección de la apertura se usa la función MathRand(). Si el valor obtenido supera (32767\2)=16383.5, se realiza la operación de compra. De lo contrario, la operación de venta. La posición se cierra dentro de cuatro horas, después de eso se abre una posición nueva siguiendo el mismo principio.
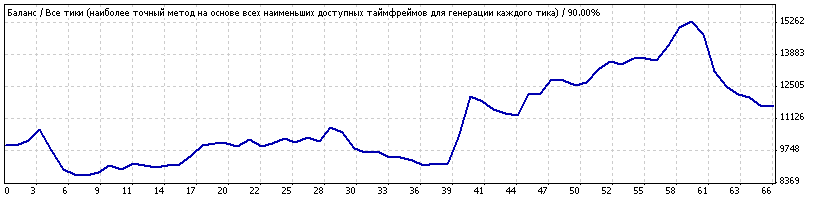
| Símbolo | EURUSD (Euro vs US Dollar) | ||||
| Período | 1 Hora (H1) 2008.03.03 00:00 - 2008.03.17 23:00 (2008.03.03 - 2008.03.18) | ||||
| Modelo | Todos los ticks (el método más preciso a base de los períodos menores disponibles) | ||||
| Barras en el historial | 1263 | Ticks modelados | 116972 | Calidad de modelación | 90.00% |
| Errores de divergencia de gráficos | 0 | ||||
| Depósito inicial | 10000,00 | ||||
| Beneficio neto | 1711,80 | Beneficio bruto | 11455,50 | Pérdidas brutas | -9743,70 |
| Factor del beneficio | 1,18 | Beneficio esperado | 25,94 | ||
| Reducción absoluta | 1400,00 | Reducción máxima | 4409.30 (28.05%) | Reducción relativa | 28.05% (4409.30) |
| Total de transacciones | 66 | Posiciones cortas (% de ganadoras) | 35 (42.86%) | Posiciones largas (% de ganadoras) | 31 (61.29%) |
| Transacciones ganadoras (% de todas) | 34 (51.52%) | Transacciones perdedoras (% de todas) | 32 (48.48%) | ||
| La transacción máxima | ganadora | 1740,00 | perdedora | -1610,00 | |
| Transacción media | ganadora | 336,93 | perdedora | -304,49 | |
| Número máximo de | ganancias consecutivas (beneficio) | 6 (1029.30) | pérdidas consecutivas (pérdida) | 6 (-3659.30) | |
| Máximo | del beneficio consecutivo (número de ganancias) | 2900.00 (2) | de pérdidas consecutivas (número de pérdidas) | -3659.30 (6) | |
| Media de | ganancia consecutiva | 2 | pérdida consecutiva | 2 | |
| № | Hora | Tipo | Orden | Volumen | Precio | S / L | T / P | Beneficio | Balance |
| 1 | 2008.03.03 00:02 | sell | 1 | 1,00 | 1,5205 | 0,0000 | 0,0000 | ||
| 2 | 2008.03.03 04:02 | close | 1 | 1,00 | 1,5205 | 0,0000 | 0,0000 | 0.00 | 10000,00 |
| 3 | 2008.03.03 04:02 | buy | 2 | 1,00 | 1.5204 | 0,0000 | 0,0000 | ||
| 4 | 2008.03.03 08:02 | close | 2 | 1,00 | 1.5225 | 0,0000 | 0,0000 | 210.00 | 10210.00 |
| 5 | 2008.03.03 08:02 | sell | 3 | 1,00 | 1.5226 | 0,0000 | 0,0000 | ||
| 6 | 2008.03.03 12:02 | close | 3 | 1,00 | 1.5179 | 0,0000 | 0,0000 | 470.00 | 10680.00 |
| 7 | 2008.03.03 12:02 | sell | 4 | 1,00 | 1.5175 | 0,0000 | 0,0000 | ||
| 8 | 2008.03.03 16:02 | close | 4 | 1,00 | 1.5266 | 0,0000 | 0,0000 | -910.00 | 9770.00 |
| 9 | 2008.03.03 16:02 | buy | 5 | 1,00 | 1.5267 | 0,0000 | 0,0000 | ||
| 10 | 2008.03.03 20:03 | close | 5 | 1,00 | 1.5183 | 0,0000 | 0,0000 | -840.00 | 8930.00 |
| 11 | 2008.03.03 20:03 | sell | 6 | 1,00 | 1.5182 | 0,0000 | 0,0000 | ||
| 12 | 2008.03.04 00:06 | close | 6 | 1,00 | 1.5201 | 0,0000 | 0,0000 | -199.30 | 8730.70 |
| 13 | 2008.03.04 00:06 | sell | 7 | 1,00 | 1.5199 | 0,0000 | 0,0000 | ||
| 14 | 2008.03.04 04:06 | close | 7 | 1,00 | 1.5202 | 0,0000 | 0,0000 | -30.00 | 8700.70 |
| 15 | 2008.03.04 04:09 | sell | 8 | 1,00 | 1.5198 | 0,0000 | 0,0000 | ||
| 16 | 2008.03.04 08:09 | close | 8 | 1,00 | 1.5185 | 0,0000 | 0,0000 | 130.00 | 8830.70 |
| 17 | 2008.03.04 08:09 | buy | 9 | 1,00 | 1.5184 | 0,0000 | 0,0000 | ||
| 18 | 2008.03.04 12:09 | close | 9 | 1,00 | 1.5215 | 0,0000 | 0,0000 | 310.00 | 9140.70 |
| 19 | 2008.03.04 12:09 | sell | 10 | 1,00 | 1.5216 | 0,0000 | 0,0000 | ||
| 20 | 2008.03.04 16:09 | close | 10 | 1,00 | 1.5233 | 0,0000 | 0,0000 | -170.00 | 8970.70 |
| 21 | 2008.03.04 16:09 | sell | 11 | 1,00 | 1.5231 | 0,0000 | 0,0000 | ||
| 22 | 2008.03.04 20:10 | close | 11 | 1,00 | 1.5208 | 0,0000 | 0,0000 | 230.00 | 9200.70 |
| 23 | 2008.03.04 20:10 | sell | 12 | 1,00 | 1.5203 | 0,0000 | 0,0000 | ||
| 24 | 2008.03.05 00:10 | close | 12 | 1,00 | 1.5208 | 0,0000 | 0,0000 | -59.30 | 9141.40 |
| 25 | 2008.03.05 00:11 | buy | 13 | 1,00 | 1.5209 | 0,0000 | 0,0000 | ||
| 26 | 2008.03.05 04:12 | close | 13 | 1,00 | 1.5200 | 0,0000 | 0,0000 | -90.00 | 9051.40 |
| 27 | 2008.03.05 04:12 | sell | 14 | 1,00 | 1.5199 | 0,0000 | 0,0000 | ||
| 28 | 2008.03.05 08:12 | close | 14 | 1,00 | 1.5190 | 0,0000 | 0,0000 | 90.00 | 9141.40 |
| 29 | 2008.03.05 08:12 | sell | 15 | 1,00 | 1.5188 | 0,0000 | 0,0000 | ||
| 30 | 2008.03.05 12:12 | close | 15 | 1,00 | 1.5184 | 0,0000 | 0,0000 | 40.00 | 9181.40 |
| 31 | 2008.03.05 12:12 | buy | 16 | 1,00 | 1.5185 | 0,0000 | 0,0000 | ||
| 32 | 2008.03.05 16:12 | close | 16 | 1,00 | 1.5223 | 0,0000 | 0,0000 | 380.00 | 9561.40 |
| 33 | 2008.03.05 16:12 | buy | 17 | 1,00 | 1.5225 | 0,0000 | 0,0000 | ||
| 34 | 2008.03.05 20:12 | close | 17 | 1,00 | 1.5268 | 0,0000 | 0,0000 | 430.00 | 9991.40 |
| 35 | 2008.03.05 20:13 | buy | 18 | 1,00 | 1.5270 | 0,0000 | 0,0000 | ||
| 36 | 2008.03.06 00:16 | close | 18 | 1,00 | 1.5278 | 0,0000 | 0,0000 | 89.30 | 10080.70 |
| 37 | 2008.03.06 00:17 | sell | 19 | 1,00 | 1.5277 | 0,0000 | 0,0000 | ||
| 38 | 2008.03.06 04:17 | close | 19 | 1,00 | 1.5277 | 0,0000 | 0,0000 | 0.00 | 10080.70 |
| 39 | 2008.03.06 04:17 | sell | 20 | 1,00 | 1.5275 | 0,0000 | 0,0000 | ||
| 40 | 2008.03.06 08:17 | close | 20 | 1,00 | 1.5290 | 0,0000 | 0,0000 | -150.00 | 9930.70 |
| 41 | 2008.03.06 08:17 | buy | 21 | 1,00 | 1.5291 | 0,0000 | 0,0000 | ||
| 42 | 2008.03.06 12:17 | close | 21 | 1,00 | 1.5322 | 0,0000 | 0,0000 | 310.00 | 10240.70 |
| 43 | 2008.03.06 12:18 | sell | 22 | 1,00 | 1.5323 | 0,0000 | 0,0000 | ||
| 44 | 2008.03.06 16:18 | close | 22 | 1,00 | 1.5353 | 0,0000 | 0,0000 | -300.00 | 9940.70 |
| 45 | 2008.03.06 16:18 | buy | 23 | 1,00 | 1.5352 | 0,0000 | 0,0000 | ||
| 46 | 2008.03.06 20:18 | close | 23 | 1,00 | 1.5367 | 0,0000 | 0,0000 | 150.00 | 10090.70 |
| 47 | 2008.03.06 20:19 | buy | 24 | 1,00 | 1.5369 | 0,0000 | 0,0000 | ||
| 48 | 2008.03.07 00:19 | close | 24 | 1,00 | 1.5387 | 0,0000 | 0,0000 | 183.10 | 10273.80 |
| 49 | 2008.03.07 00:19 | buy | 25 | 1,00 | 1.5391 | 0,0000 | 0,0000 | ||
| 50 | 2008.03.07 04:20 | close | 25 | 1,00 | 1.5374 | 0,0000 | 0,0000 | -170.00 | 10103.80 |
| 51 | 2008.03.07 04:20 | buy | 26 | 1,00 | 1.5378 | 0,0000 | 0,0000 | ||
| 52 | 2008.03.07 08:20 | close | 26 | 1,00 | 1.5400 | 0,0000 | 0,0000 | 220.00 | 10323.80 |
| 53 | 2008.03.07 08:21 | sell | 27 | 1,00 | 1.5401 | 0,0000 | 0,0000 | ||
| 54 | 2008.03.07 12:21 | close | 27 | 1,00 | 1.5419 | 0,0000 | 0,0000 | -180.00 | 10143.80 |
| 55 | 2008.03.07 12:21 | sell | 28 | 1,00 | 1.5417 | 0,0000 | 0,0000 | ||
| 56 | 2008.03.07 16:21 | close | 28 | 1,00 | 1.5356 | 0,0000 | 0,0000 | 610.00 | 10753.80 |
| 57 | 2008.03.07 16:21 | buy | 29 | 1,00 | 1.5358 | 0,0000 | 0,0000 | ||
| 58 | 2008.03.07 20:21 | close | 29 | 1,00 | 1.5337 | 0,0000 | 0,0000 | -210.00 | 10543.80 |
| 59 | 2008.03.07 20:21 | sell | 30 | 1,00 | 1.5336 | 0,0000 | 0,0000 | ||
| 60 | 2008.03.10 00:00 | close | 30 | 1,00 | 1.5402 | 0,0000 | 0,0000 | -669.30 | 9874.50 |
| 61 | 2008.03.10 00:00 | buy | 31 | 1,00 | 1.5401 | 0,0000 | 0,0000 | ||
| 62 | 2008.03.10 04:01 | close | 31 | 1,00 | 1.5383 | 0,0000 | 0,0000 | -180.00 | 9694.50 |
| 63 | 2008.03.10 04:01 | buy | 32 | 1,00 | 1.5385 | 0,0000 | 0,0000 | ||
| 64 | 2008.03.10 08:02 | close | 32 | 1,00 | 1.5389 | 0,0000 | 0,0000 | 40.00 | 9734.50 |
| 65 | 2008.03.10 08:02 | buy | 33 | 1,00 | 1.5389 | 0,0000 | 0,0000 | ||
| 66 | 2008.03.10 12:03 | close | 33 | 1,00 | 1.5363 | 0,0000 | 0,0000 | -260.00 | 9474.50 |
| 67 | 2008.03.10 12:03 | sell | 34 | 1,00 | 1.5362 | 0,0000 | 0,0000 | ||
| 68 | 2008.03.10 16:03 | close | 34 | 1,00 | 1.5361 | 0,0000 | 0,0000 | 10.00 | 9484.50 |
| 69 | 2008.03.10 16:03 | buy | 35 | 1,00 | 1.5362 | 0,0000 | 0,0000 | ||
| 70 | 2008.03.10 20:04 | close | 35 | 1,00 | 1.5346 | 0,0000 | 0,0000 | -160.00 | 9324.50 |
| 71 | 2008.03.10 20:04 | sell | 36 | 1,00 | 1.5345 | 0,0000 | 0,0000 | ||
| 72 | 2008.03.11 00:04 | close | 36 | 1,00 | 1.5366 | 0,0000 | 0,0000 | -219.30 | 9105.20 |
| 73 | 2008.03.11 00:05 | sell | 37 | 1,00 | 1.5364 | 0,0000 | 0,0000 | ||
| 74 | 2008.03.11 04:05 | close | 37 | 1,00 | 1.5354 | 0,0000 | 0,0000 | 100.00 | 9205.20 |
| 75 | 2008.03.11 04:05 | buy | 38 | 1,00 | 1.5356 | 0,0000 | 0,0000 | ||
| 76 | 2008.03.11 08:05 | close | 38 | 1,00 | 1.5354 | 0,0000 | 0,0000 | -20.00 | 9185.20 |
| 77 | 2008.03.11 08:06 | buy | 39 | 1,00 | 1.5356 | 0,0000 | 0,0000 | ||
| 78 | 2008.03.11 12:06 | close | 39 | 1,00 | 1.5472 | 0,0000 | 0,0000 | 1160.00 | 10345.20 |
| 79 | 2008.03.11 12:06 | sell | 40 | 1,00 | 1.5471 | 0,0000 | 0,0000 | ||
| 80 | 2008.03.11 16:06 | close | 40 | 1,00 | 1.5297 | 0,0000 | 0,0000 | 1740,00 | 12085.20 |
| 81 | 2008.03.11 16:06 | sell | 41 | 1,00 | 1.5293 | 0,0000 | 0,0000 | ||
| 82 | 2008.03.11 20:06 | close | 41 | 1,00 | 1.5312 | 0,0000 | 0,0000 | -190.00 | 11895.20 |
| 83 | 2008.03.11 20:06 | sell | 42 | 1,00 | 1.5310 | 0,0000 | 0,0000 | ||
| 84 | 2008.03.12 00:07 | close | 42 | 1,00 | 1.5344 | 0,0000 | 0,0000 | -349.30 | 11545.90 |
| 85 | 2008.03.12 00:07 | sell | 43 | 1,00 | 1.5342 | 0,0000 | 0,0000 | ||
| 86 | 2008.03.12 04:07 | close | 43 | 1,00 | 1.5359 | 0,0000 | 0,0000 | -170.00 | 11375.90 |
| 87 | 2008.03.12 04:07 | sell | 44 | 1,00 | 1.5355 | 0,0000 | 0,0000 | ||
| 88 | 2008.03.12 08:07 | close | 44 | 1,00 | 1.5365 | 0,0000 | 0,0000 | -100.00 | 11275.90 |
| 89 | 2008.03.12 08:07 | buy | 45 | 1,00 | 1.5364 | 0,0000 | 0,0000 | ||
| 90 | 2008.03.12 12:08 | close | 45 | 1,00 | 1.5456 | 0,0000 | 0,0000 | 920.00 | 12195.90 |
| 91 | 2008.03.12 12:08 | buy | 46 | 1,00 | 1.5461 | 0,0000 | 0,0000 | ||
| 92 | 2008.03.12 16:08 | close | 46 | 1,00 | 1.5464 | 0,0000 | 0,0000 | 30.00 | 12225.90 |
| 93 | 2008.03.12 16:08 | buy | 47 | 1,00 | 1.5468 | 0,0000 | 0,0000 | ||
| 94 | 2008.03.12 20:08 | close | 47 | 1,00 | 1.5530 | 0,0000 | 0,0000 | 620.00 | 12845.90 |
| 95 | 2008.03.12 20:08 | sell | 48 | 1,00 | 1.5533 | 0,0000 | 0,0000 | ||
| 96 | 2008.03.13 00:08 | close | 48 | 1,00 | 1.5537 | 0,0000 | 0,0000 | -67.90 | 12778.00 |
| 97 | 2008.03.13 00:08 | sell | 49 | 1,00 | 1.5536 | 0,0000 | 0,0000 | ||
| 98 | 2008.03.13 04:08 | close | 49 | 1,00 | 1.5557 | 0,0000 | 0,0000 | -210.00 | 12568.00 |
| 99 | 2008.03.13 04:09 | sell | 50 | 1,00 | 1.5553 | 0,0000 | 0,0000 | ||
| 100 | 2008.03.13 08:09 | close | 50 | 1,00 | 1.5541 | 0,0000 | 0,0000 | 120.00 | 12688.00 |
| 101 | 2008.03.13 08:09 | buy | 51 | 1,00 | 1.5542 | 0,0000 | 0,0000 | ||
| 102 | 2008.03.13 12:09 | close | 51 | 1,00 | 1.5599 | 0,0000 | 0,0000 | 570.00 | 13258.00 |
| 103 | 2008.03.13 12:09 | sell | 52 | 1,00 | 1.5600 | 0,0000 | 0,0000 | ||
| 104 | 2008.03.13 16:09 | close | 52 | 1,00 | 1.5567 | 0,0000 | 0,0000 | 330.00 | 13588.00 |
| 105 | 2008.03.13 16:09 | sell | 53 | 1,00 | 1.5565 | 0,0000 | 0,0000 | ||
| 106 | 2008.03.13 20:09 | close | 53 | 1,00 | 1.5576 | 0,0000 | 0,0000 | -110.00 | 13478.00 |
| 107 | 2008.03.13 20:10 | buy | 54 | 1,00 | 1.5577 | 0,0000 | 0,0000 | ||
| 108 | 2008.03.14 00:11 | close | 54 | 1,00 | 1.5601 | 0,0000 | 0,0000 | 243.10 | 13721.10 |
| 109 | 2008.03.14 00:11 | buy | 55 | 1,00 | 1.5605 | 0,0000 | 0,0000 | ||
| 110 | 2008.03.14 04:11 | close | 55 | 1,00 | 1.5605 | 0,0000 | 0,0000 | 0.00 | 13721.10 |
| 111 | 2008.03.14 04:12 | sell | 56 | 1,00 | 1.5606 | 0,0000 | 0,0000 | ||
| 112 | 2008.03.14 08:12 | close | 56 | 1,00 | 1.5613 | 0,0000 | 0,0000 | -70.00 | 13651.10 |
| 113 | 2008.03.14 08:13 | sell | 57 | 1,00 | 1.5611 | 0,0000 | 0,0000 | ||
| 114 | 2008.03.14 12:13 | close | 57 | 1,00 | 1.5545 | 0,0000 | 0,0000 | 660.00 | 14311.10 |
| 115 | 2008.03.14 12:13 | buy | 58 | 1,00 | 1.5546 | 0,0000 | 0,0000 | ||
| 116 | 2008.03.14 16:13 | close | 58 | 1,00 | 1.5622 | 0,0000 | 0,0000 | 760.00 | 15071.10 |
| 117 | 2008.03.14 16:14 | buy | 59 | 1,00 | 1.5626 | 0,0000 | 0,0000 | ||
| 118 | 2008.03.14 20:14 | close | 59 | 1,00 | 1.5652 | 0,0000 | 0,0000 | 260.00 | 15331.10 |
| 119 | 2008.03.14 20:14 | sell | 60 | 1,00 | 1.5653 | 0,0000 | 0,0000 | ||
| 120 | 2008.03.17 00:00 | close | 60 | 1,00 | 1.5707 | 0,0000 | 0,0000 | -549.30 | 14781.80 |
| 121 | 2008.03.17 00:00 | sell | 61 | 1,00 | 1.5705 | 0,0000 | 0,0000 | ||
| 122 | 2008.03.17 04:00 | close | 61 | 1,00 | 1.5866 | 0,0000 | 0,0000 | -1610,00 | 13171.80 |
| 123 | 2008.03.17 04:00 | buy | 62 | 1,00 | 1.5865 | 0,0000 | 0,0000 | ||
| 124 | 2008.03.17 08:00 | close | 62 | 1,00 | 1.5802 | 0,0000 | 0,0000 | -630.00 | 12541.80 |
| 125 | 2008.03.17 08:00 | buy | 63 | 1,00 | 1.5806 | 0,0000 | 0,0000 | ||
| 126 | 2008.03.17 12:00 | close | 63 | 1,00 | 1.5770 | 0,0000 | 0,0000 | -360.00 | 12181.80 |
| 127 | 2008.03.17 12:00 | buy | 64 | 1,00 | 1.5772 | 0,0000 | 0,0000 | ||
| 128 | 2008.03.17 16:01 | close | 64 | 1,00 | 1.5758 | 0,0000 | 0,0000 | -140.00 | 12041.80 |
| 129 | 2008.03.17 16:01 | buy | 65 | 1,00 | 1.5762 | 0,0000 | 0,0000 | ||
| 130 | 2008.03.17 20:01 | close | 65 | 1,00 | 1.5725 | 0,0000 | 0,0000 | -370.00 | 11671.80 |
| 131 | 2008.03.17 20:02 | sell | 66 | 1,00 | 1.5723 | 0,0000 | 0,0000 | ||
| 132 | 2008.03.17 23:59 | close at stop | 66 | 1,00 | 1.5719 | 0,0000 | 0,0000 | 40.00 | 11711.80 |
Traducción del ruso realizada por MetaQuotes Ltd
Artículo original: https://www.mql5.com/ru/code/8177
Se necesita el complemento de seguimiento de picos y depresiones...
El Asesor Experto trabaja en la señal AMA con EURUSD M1.
 Intercambio de datos y gestión Excel
Librería DLL para la gestión e intercambio de datos entre МetaТrader 4 y Excel.
 Silver-channels
El indicador colocado en Ichimoku permite tradear tanto en la tendencia, como en el modo flat del mercado.
SignalTable
Este indicador original muestra las señales de compra y de venta.