Mira cómo descargar robots gratis
¡Búscanos en Twitter!
Pon "Me gusta" y sigue las noticias
Pon "Me gusta" y sigue las noticias
¿Es interesante este script?
Deje un enlace a él, ¡qué los demás también lo valoren!
Deje un enlace a él, ¡qué los demás también lo valoren!
¿Le ha gustado el script?
Evalúe su trabajo en el terminal MetaTrader 5
Evalúe su trabajo en el terminal MetaTrader 5

Ticker Awesome Oscillator - indicador para MetaTrader 4
- Visualizaciones:
- 17823
- Ranking:
- Publicado:
- Actualizado:
-
 Está perdiendo oportunidades comerciales:
- Aplicaciones de trading gratuitas
- 8 000+ señales para copiar
- Noticias económicas para analizar los mercados financieros
Registro EntradaUsted acepta la política del sitio web y las condiciones de uso
Si no tiene cuenta de usuario, regístrese -
 ¿Necesita un robot o indicador basado en este código? Solicítelo en la bolsa freelance
Pasar a la bolsa
¿Necesita un robot o indicador basado en este código? Solicítelo en la bolsa freelance
Pasar a la bolsa
Author: mandorr
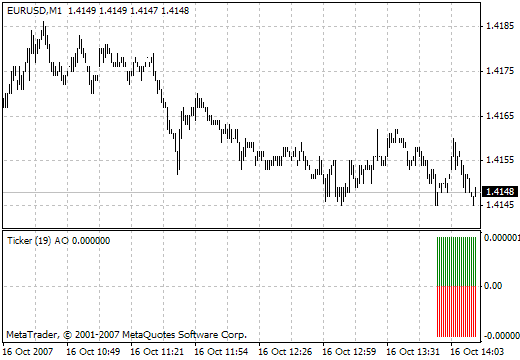
It is calculated as the difference between two simple moving averages: SMA(5) and SMA(34). Type of the chart: histogram with green and red colored bars.
In the "Ticker Awesome Oscillator" indicator the buffer with the index 0 (№0 in the "Colors" tab) is the hidden line, it returns the value of the oscillator when called from an EA. The buffer with the index 1 (№1 in the "Colors" tab) shows the rising bars, it is equal to zero for the falling bars. The buffer with the index 2 (№2 in the "Colors" tab) shows the falling bars, it is equal to zero for the rising bars. The plotting of the histogram starts from the 35th tick.
Traducción del ruso realizada por MetaQuotes Ltd
Artículo original: https://www.mql5.com/ru/code/7490
Lagrange polynomial
Two options of the calculation, which creates the Lagrange polynomial based on the reference points.
camarilladt8
It is suitable for those who are too lazy to calculate the daily levels.
Ticker MACD
The chart contains the main line (the difference between the fast EMA and the slow EMA, applied to the Ticker line) and the signal line (obtained by applying the SMA to the main line).
Ticker Trail
Here, the trail line is used instead of the signal line. Trail is the line that is distanced from the current price no more than the trailing length.