Pon "Me gusta" y sigue las noticias
Deje un enlace a él, ¡qué los demás también lo valoren!
Evalúe su trabajo en el terminal MetaTrader 5
- Visualizaciones:
- 32349
- Ranking:
- Publicado:
- Actualizado:
-
¿Necesita un robot o indicador basado en este código? Solicítelo en la bolsa freelance Pasar a la bolsa
The classic CCI indicator uses Moving Average of Typical price. This version uses median line of the Step Channel indicator.
This line will be created from the result of tug of war between [raising price] and [falling price].
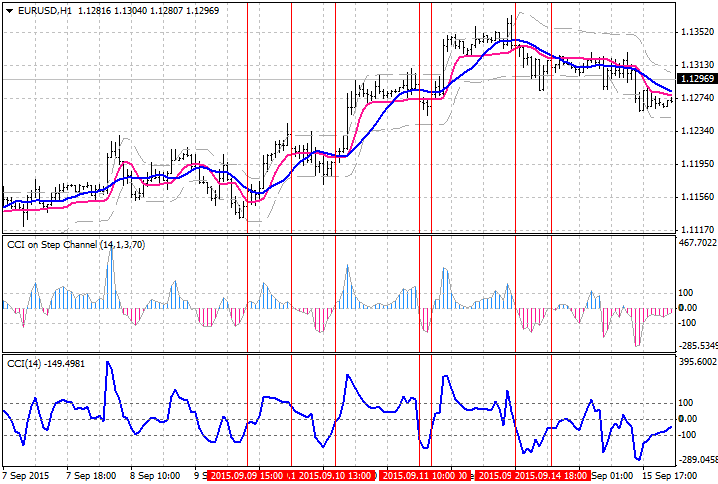
This chart shows the differences.
- Blue Line is Typical SMA(14),
- Pink Line is Volatility Step Channel(StdDev(1.0), Ma(3), Volatility(70)).

Recommendations:

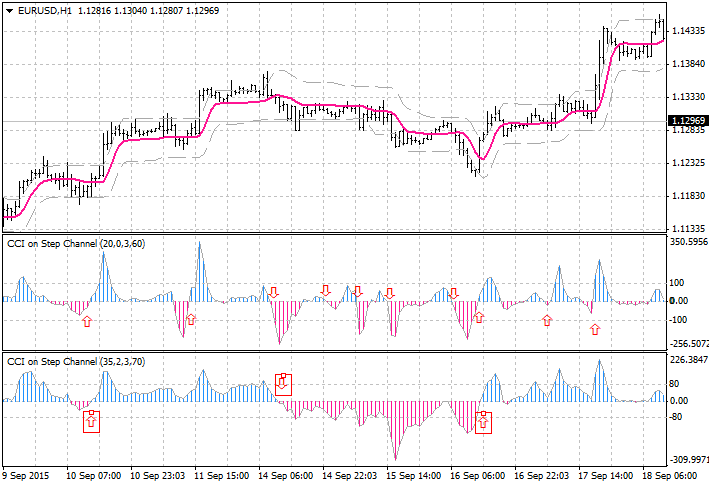
Use 2 period CCI

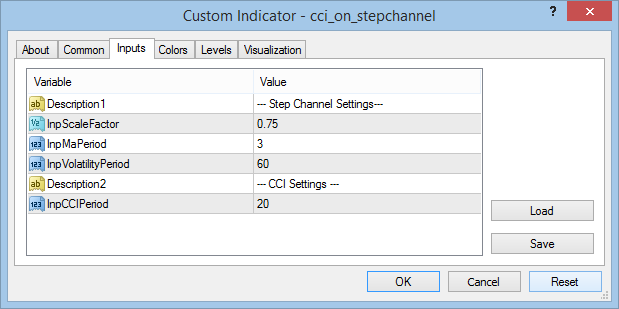
Fast period CCI

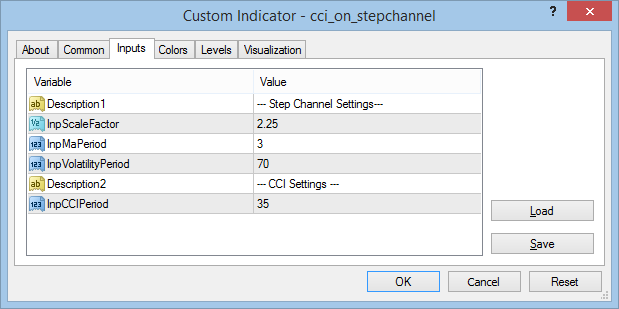
Slow period CCI
 Master Tools
Money Management / Pivot / Daily Open / Support-Resistance / Grid / Information of all kind / Tendency indicator.
 Daily Break Point
This an H1 strategy. This EA will execute at the new bar if the last bar has broken through the point that we set.
 History Dump CSV with heat map for Excel analysis
This script creates a .CSV file of your order history so you can import it into Excel and analyse it using the calculated heat map slots and other calculated values. All trading attributes are extracted from the history and output to the .CSV file. Updated version 1.03 (about 27KB) has NetProfit, OpenDay, OpenHour, OpenSlot, CloseDay, CloseHour, CloseSlot, DurationMinutes, PotentialWinPips, PotentialLossPips and others. The file is tab delimited for easier conversion from text to columns in Excel. Times are server time. Handles 4 and 5 digit brokers and 2/3 and 4/5 point value pairs, e.g. JPY correctly.
 Custom Bollinger Bands
Bollinger Bands with customizable moving average method and applied price.