Mira cómo descargar robots gratis
¡Búscanos en Twitter!
Pon "Me gusta" y sigue las noticias
Pon "Me gusta" y sigue las noticias
¿Es interesante este script?
Deje un enlace a él, ¡qué los demás también lo valoren!
Deje un enlace a él, ¡qué los demás también lo valoren!
¿Le ha gustado el script?
Evalúe su trabajo en el terminal MetaTrader 5
Evalúe su trabajo en el terminal MetaTrader 5
- Publicado por:
-
Aleh Sasonka
 ✍️ Development and modification of experts, scripts, indicators MQL4, MQL5 to order https://www.mql5.com/en/job/new?prefered=sova75
 - Visualizaciones:
- 73422
- Ranking:
- Publicado:
- Actualizado:
-
 Está perdiendo oportunidades comerciales:
- Aplicaciones de trading gratuitas
- 8 000+ señales para copiar
- Noticias económicas para analizar los mercados financieros
Registro EntradaUsted acepta la política del sitio web y las condiciones de uso
Si no tiene cuenta de usuario, regístrese -
 ¿Necesita un robot o indicador basado en este código? Solicítelo en la bolsa freelance
Pasar a la bolsa
¿Necesita un robot o indicador basado en este código? Solicítelo en la bolsa freelance
Pasar a la bolsa
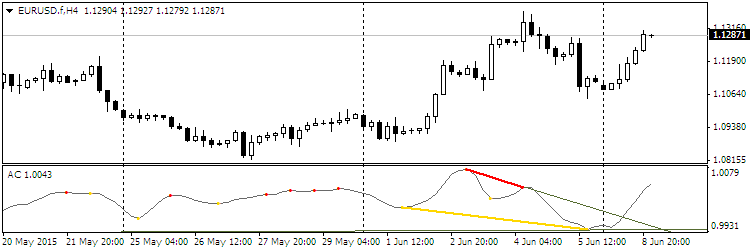
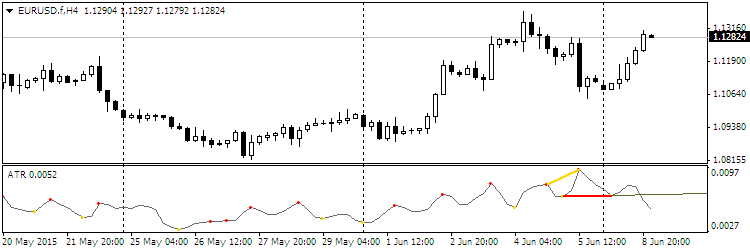
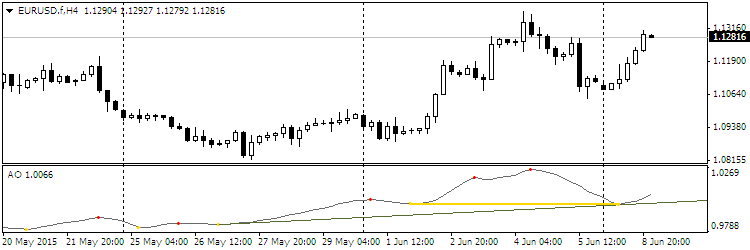
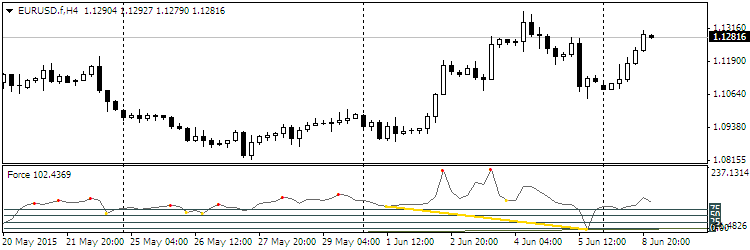
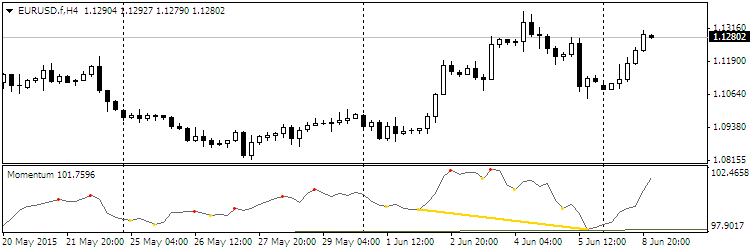
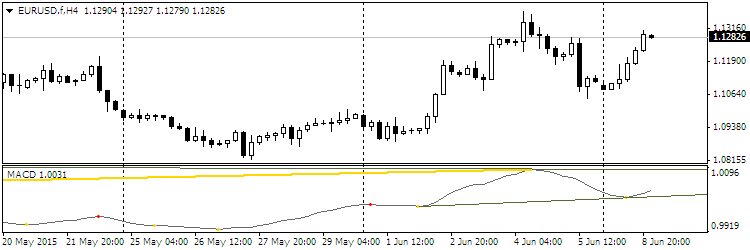
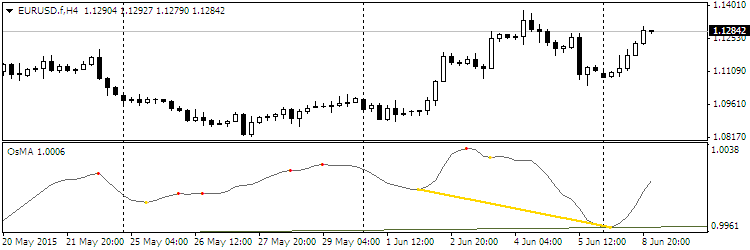
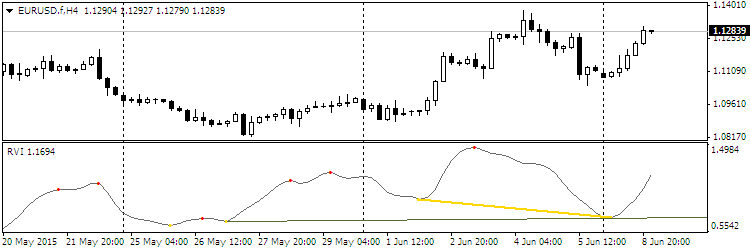
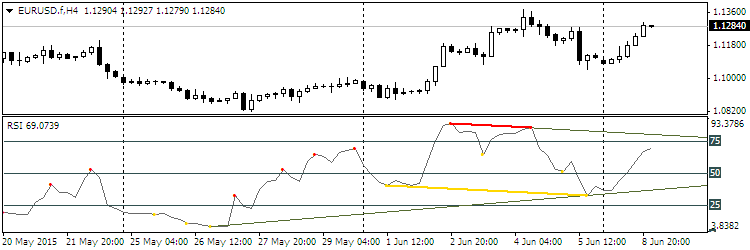
The indicator to trade Divergence.
One of 30 oscillators can be selected for the detection of the divergences.
Indicator values:
- Extremes as points (red — Highs, yellow — Lows);
- Divergence using the segments connecting the extremes;
- The support/resistance lines as rays passing through the extremes;
- Channels as rays.
Selection of the required oscillator is performed in the line by entering the oscillator number — the Osc parameter. By default, the RSI indicator is set (number 29).
Oscillator selection:
- Accelerator
- Accumulation/Distribution
- Average Directional Movement Index
- Average True Range
- Awesome oscillator
- Bears Power
- Bulls Power
- Commodity Channel Index
- DeMarker
- Force Index
- Momentum
- Money Flow Index
- Moving Averages Convergence/Divergence
- Moving Average of Oscillator
- On Balance Volume
- Relative Vigor Index
- Standard Deviation
- Stochastic Oscillator
- Volume
- Close
- Open
- High
- Low
- (H+L)/2
- (H+L+C)/3
- (H+L+C+C)/4
- (O+C+H+L)/4
- (O+C)/2
- Relative Strength Index
- Larry Williams' Percent Range
- ... Relative Strength Index
The list of adjustable parameters:
- Osc=29 — the number of the oscillator;
- TH=true — bearish divergence;
- TL=true — bullish divergence;
- trend=true — support/resistance lines;
- convergen=true — hidden divergence;
- Complect=1 — the distinguishing index of the indicator on the chart;
- BackSteph=0 — number of steps back h;
- BackStepl=0 — number of steps back l;
- BackStep=0 — number of steps back;
- qSteps=1 — number of displayed steps, no more than three;
- LevDPl=5 — DeMark level points (2 = the central bar will be above (below) the two bars on the left);
- LevDPr=1 — DeMark level points (2 = the central bar will be above (below) the two bars on the right);
- period=8 — period for iADX, iATR, iBearsPower, iBullsPower, iCCI, iDeMarker, iForce, iMomentum, iMFI, iRVI, iStdDev, iRSI, iRSI, iWPR;
- ma_method=0 — averaging method for iStochastic, iStdDev, iForce;
- ma_shift=0 — MA shift for iStdDev;
- applied_price=4 — applied price for iRSI, iRSI, iStdDev, iOBV, iOsMA, iMACD, iMomentum, iForce, iCCIiBullsPower, iBearsPower, iADX;
- mode=0 — line index for iStochastic, iRVI, iMACD, iADX;
- fast_ema_period=12 — fast MA period for iOsMA, iMACD;
- slow_ema_period=26 — slow MA period for iOsMA, iMACD;
- signal_period=9 — signal line period for iOsMA, iMACD;
- Kperiod=13 — K line period for iStochastic;
- Dperiod=5 — D line period for iStochastic;
- slowing=3 — slowing for iStochastic;
- price_field=0 — applied price for iStochastic;
- showBars=1000 — if = 0, the indicator is displayed for the entire chart;
- Trend_Down=true — resistance lines;
- Trend_Up=true — support lines;
- TrendLine=true — support/resistance lines;
- HandyColour=true;
- Highline=Red — HL channel color;
- Lowline=DeepSkyBlue — LL channel color;;
- ChannelLine=false — channels parallel to trend lines;
- Trend=0 — 1 = only for UpTrendLines, -1 = only for DownTrendLines, 0 = for all TrendLines;
- Channel=false — channels;
- Regression=true — Linear Regression Channel, false — Standard Deviation Channel;
- RayH=true — ray for the High channel;
- RayL=true — ray for the Low channel;
- ChannelH=Red — color of the High channel;
- ChannelL=DeepSkyBlue — color of the Low channel;
- STD_widthH=1.0 — deviation size for the CHANNEL High object;
- STD_widthL=1.0 — deviation size for the CHANNEL Low object;
- comment=false — display comments;
- code=159 — character code of the Wingdings font to display the extremums;
- BuyStop=false — BuyStop levels;
- SellLimit=false — SellLimit levels;
- SellStop=false — SellStop levels;
- BuyLimit=false — BuyLimit levels.
Examples:
Recommendations:
- The color of the oscillator and the extremum points can be configured in the Colors tab.
- Change the Complect parameter when attaching more than one indicator to the chart.
Traducción del ruso realizada por MetaQuotes Ltd
Artículo original: https://www.mql5.com/ru/code/13172
 Binario
The Expert Advisor is based on the exponential moving averages of the same period.
 Pinbar Detector
The Pinbar Detector indicator tries to identify the pin bars.