Watch how to download trading robots for free
Find us on Facebook!
Join our fan page
Join our fan page
You liked the script? Try it in the MetaTrader 5 terminal
- Published by:
-
Aleh Sasonka
 ✍️ Development and modification of experts, scripts, indicators MQL4, MQL5 to order https://www.mql5.com/en/job/new?prefered=sova75
 - Views:
- 73587
- Rating:
- Published:
- Updated:
-
 You are missing trading opportunities:
- Free trading apps
- Over 8,000 signals for copying
- Economic news for exploring financial markets
Registration Log inYou agree to website policy and terms of use
If you do not have an account, please register -
 Need a robot or indicator based on this code? Order it on Freelance
Go to Freelance
Need a robot or indicator based on this code? Order it on Freelance
Go to Freelance
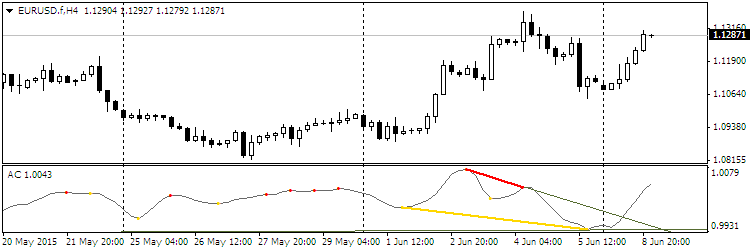
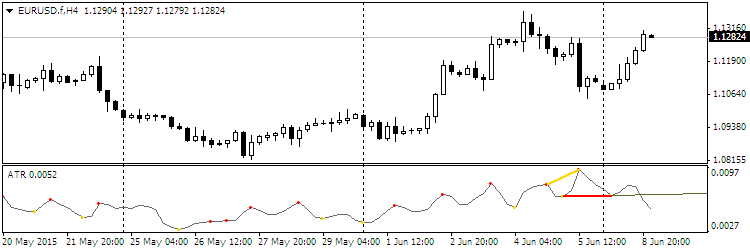
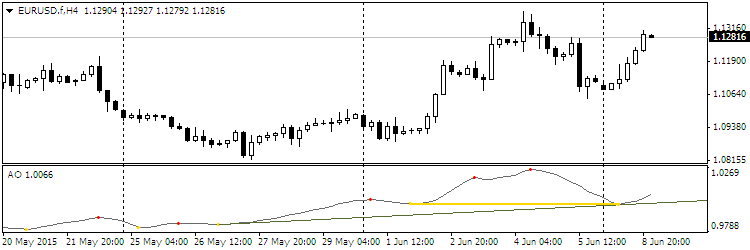
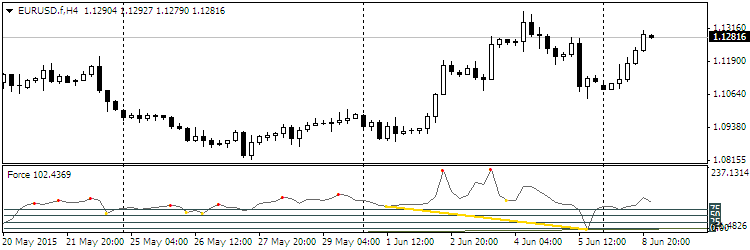
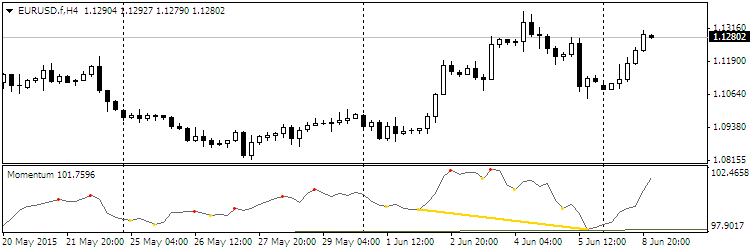
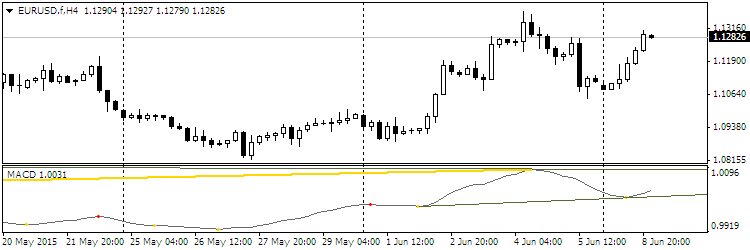
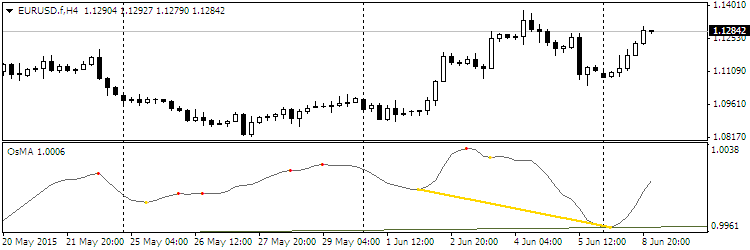
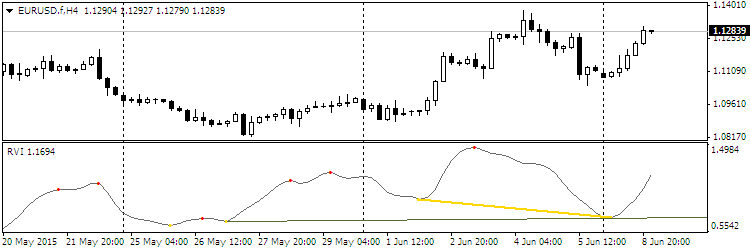
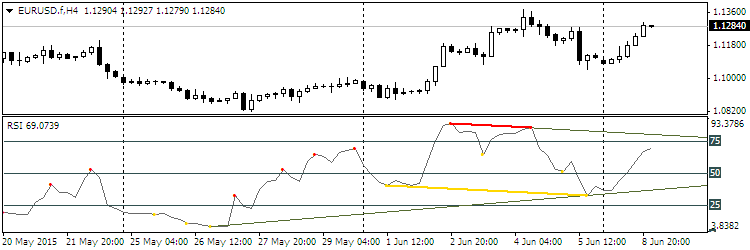
The indicator to trade Divergence.
One of 30 oscillators can be selected for the detection of the divergences.
Indicator values:
- Extremes as points (red — Highs, yellow — Lows);
- Divergence using the segments connecting the extremes;
- The support/resistance lines as rays passing through the extremes;
- Channels as rays.
Selection of the required oscillator is performed in the line by entering the oscillator number — the Osc parameter. By default, the RSI indicator is set (number 29).
Oscillator selection:
- Accelerator
- Accumulation/Distribution
- Average Directional Movement Index
- Average True Range
- Awesome oscillator
- Bears Power
- Bulls Power
- Commodity Channel Index
- DeMarker
- Force Index
- Momentum
- Money Flow Index
- Moving Averages Convergence/Divergence
- Moving Average of Oscillator
- On Balance Volume
- Relative Vigor Index
- Standard Deviation
- Stochastic Oscillator
- Volume
- Close
- Open
- High
- Low
- (H+L)/2
- (H+L+C)/3
- (H+L+C+C)/4
- (O+C+H+L)/4
- (O+C)/2
- Relative Strength Index
- Larry Williams' Percent Range
- ... Relative Strength Index
The list of adjustable parameters:
- Osc=29 — the number of the oscillator;
- TH=true — bearish divergence;
- TL=true — bullish divergence;
- trend=true — support/resistance lines;
- convergen=true — hidden divergence;
- Complect=1 — the distinguishing index of the indicator on the chart;
- BackSteph=0 — number of steps back h;
- BackStepl=0 — number of steps back l;
- BackStep=0 — number of steps back;
- qSteps=1 — number of displayed steps, no more than three;
- LevDPl=5 — DeMark level points (2 = the central bar will be above (below) the two bars on the left);
- LevDPr=1 — DeMark level points (2 = the central bar will be above (below) the two bars on the right);
- period=8 — period for iADX, iATR, iBearsPower, iBullsPower, iCCI, iDeMarker, iForce, iMomentum, iMFI, iRVI, iStdDev, iRSI, iRSI, iWPR;
- ma_method=0 — averaging method for iStochastic, iStdDev, iForce;
- ma_shift=0 — MA shift for iStdDev;
- applied_price=4 — applied price for iRSI, iRSI, iStdDev, iOBV, iOsMA, iMACD, iMomentum, iForce, iCCIiBullsPower, iBearsPower, iADX;
- mode=0 — line index for iStochastic, iRVI, iMACD, iADX;
- fast_ema_period=12 — fast MA period for iOsMA, iMACD;
- slow_ema_period=26 — slow MA period for iOsMA, iMACD;
- signal_period=9 — signal line period for iOsMA, iMACD;
- Kperiod=13 — K line period for iStochastic;
- Dperiod=5 — D line period for iStochastic;
- slowing=3 — slowing for iStochastic;
- price_field=0 — applied price for iStochastic;
- showBars=1000 — if = 0, the indicator is displayed for the entire chart;
- Trend_Down=true — resistance lines;
- Trend_Up=true — support lines;
- TrendLine=true — support/resistance lines;
- HandyColour=true;
- Highline=Red — HL channel color;
- Lowline=DeepSkyBlue — LL channel color;;
- ChannelLine=false — channels parallel to trend lines;
- Trend=0 — 1 = only for UpTrendLines, -1 = only for DownTrendLines, 0 = for all TrendLines;
- Channel=false — channels;
- Regression=true — Linear Regression Channel, false — Standard Deviation Channel;
- RayH=true — ray for the High channel;
- RayL=true — ray for the Low channel;
- ChannelH=Red — color of the High channel;
- ChannelL=DeepSkyBlue — color of the Low channel;
- STD_widthH=1.0 — deviation size for the CHANNEL High object;
- STD_widthL=1.0 — deviation size for the CHANNEL Low object;
- comment=false — display comments;
- code=159 — character code of the Wingdings font to display the extremums;
- BuyStop=false — BuyStop levels;
- SellLimit=false — SellLimit levels;
- SellStop=false — SellStop levels;
- BuyLimit=false — BuyLimit levels.
Examples:
Recommendations:
- The color of the oscillator and the extremum points can be configured in the Colors tab.
- Change the Complect parameter when attaching more than one indicator to the chart.
Translated from Russian by MetaQuotes Ltd.
Original code: https://www.mql5.com/ru/code/13172
 Binario
The Expert Advisor is based on the exponential moving averages of the same period.
 Pinbar Detector
The Pinbar Detector indicator tries to identify the pin bars.