Quorum Oscillator

QUORUM OSCILLATOR – Adaptive Market Regime & Momentum Oscillator

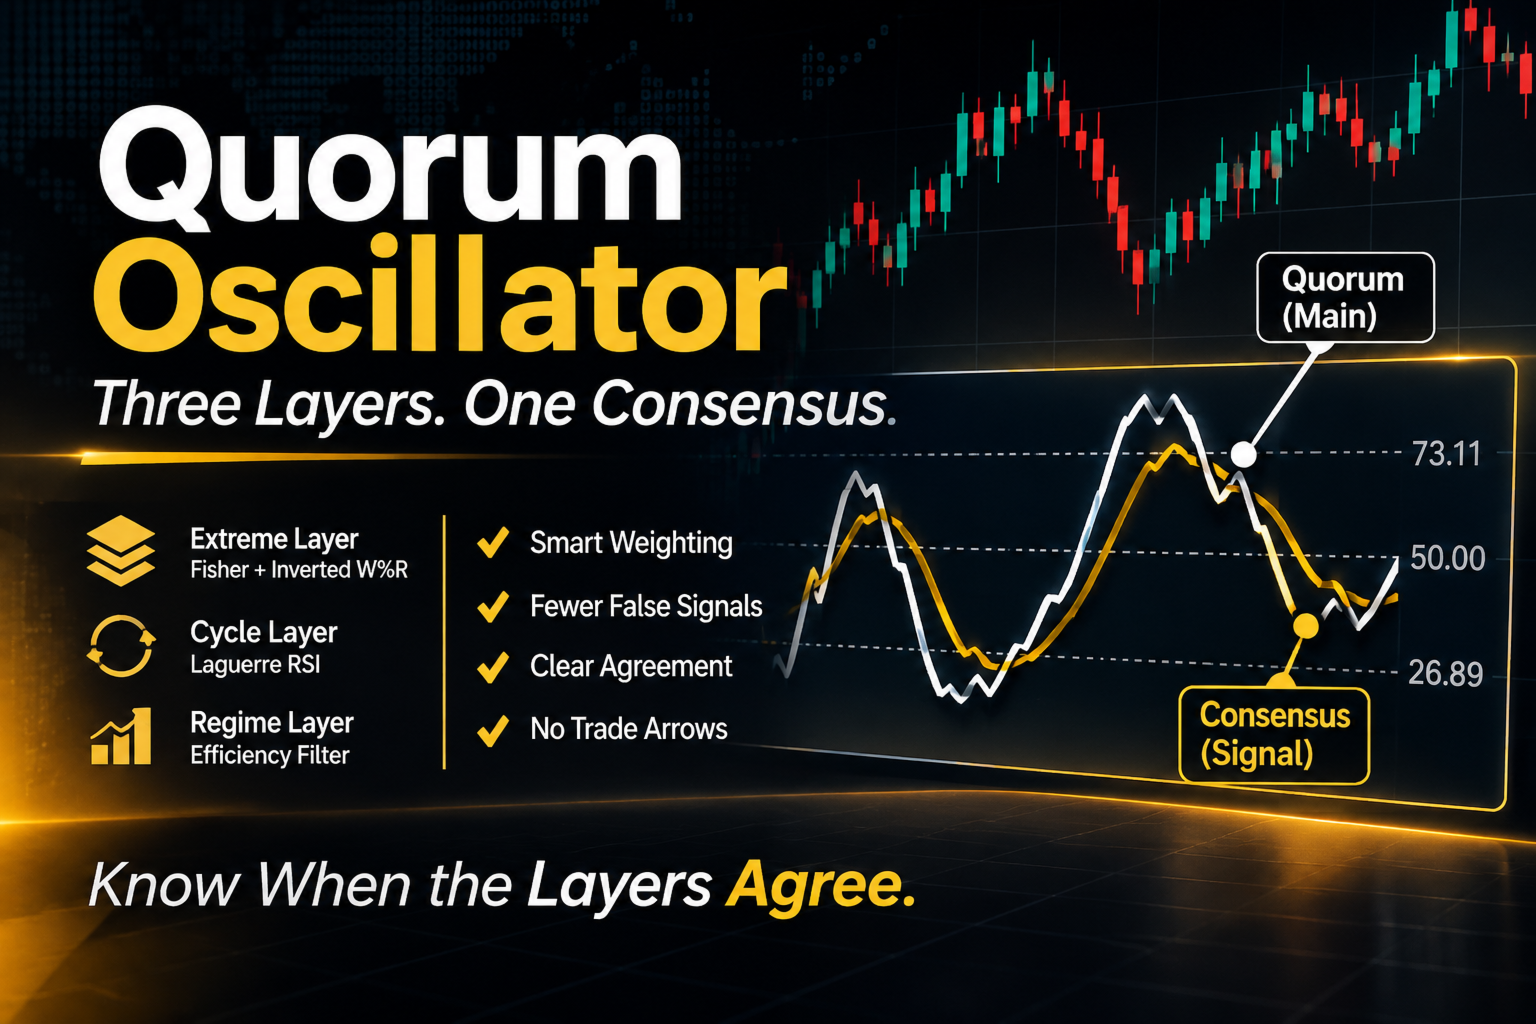
Three layers of analysis. Two lines. A more complete read of the market.

Quorum Oscillator is a technical indicator for MetaTrader 5 that combines extreme analysis, cyclical behavior, and directional efficiency into a single visual oscillator.

Unlike traditional oscillators, which maintain a constant interpretation regardless of market conditions, Quorum dynamically adapts its calculations to place greater emphasis on extremes in ranging markets and on cyclical behavior in trending markets.

The result is a tool designed to help traders better interpret momentum, recognize potential shifts in direction, and evaluate when different market components begin to align.

What makes Quorum different?

Quorum operates using three complementary layers:

  1. Extreme Layer – Extreme Detection Uses an inverted Williams %R to gauge price position within its range and applies a Fisher transform to achieve a more sensitive reading of extreme price movements. It helps identify when price reaches relatively overextended positions within its recent range.

  2. Cycle Layer – Cycle Analysis Incorporates the Laguerre RSI to analyze shifts in rhythm and market oscillations. Its role is to provide insight into cyclical behavior and help recognize potential momentum transitions.

  3. Regime Layer – Market Adaptation Uses the Kaufman Efficiency Ratio (ER) to estimate whether the market is exhibiting predominantly ranging or trending behavior. This layer does not generate a third line. Instead, it dynamically adjusts the weighting of the other two:

  • In ranging conditions, it increases the weight of the extreme analysis.

  • In trending conditions, it increases the weight of the cyclical analysis.

  • Between both regimes, the transition is gradual. With default parameters, the weighting shifts approximately from 65/35 to 35/65 between extremes and cycle.

Two lines, two perspectives

  • Quorum – White line Represents the current state of the market through the adaptive combination of Fisher and Laguerre. It allows you to observe how extremes and cyclical behavior interact while accounting for prevailing market conditions.

  • Consensus – Gold line An independent second composite, not a simple moving average of Quorum. It combines smoothed Fisher, smoothed Laguerre, and a regime-based directional bias component. In uptrends, this component shifts the reference moderately upward; in downtrends, downward. In this way, the consensus line incorporates directional context without relying solely on recent price direction.

How to interpret the indicator

The crossover between Quorum and Consensus represents a point of convergence between the current state of the market and its consensus reference.

  • Bullish crossover: Quorum crosses above Consensus. This may indicate a favorable shift in momentum, especially when occurring from lower levels.

  • Bearish crossover: Quorum crosses below Consensus. This may indicate weakening momentum, especially when occurring from upper levels.

  • Separated lines: Indicates divergence between the current market state and consensus.

  • Converging lines: Both perspectives are coming into alignment.

  • Both lines rising: Both current behavior and consensus show favorable momentum.

  • Both lines falling: Both perspectives indicate a weakening market.

The gray horizontal levels (26.89, 50, and 73.11 under default settings) serve as visual scale references. They do not represent automatic signals or buy/sell orders.

Key advantages

  • Regime adaptation: Modifies the relative importance of its components according to market conditions.

  • Complementary analysis: Combines extremes and cyclical behavior instead of duplicating indicators that essentially measure the same thing.

  • Independent consensus: Incorporates a second perspective that accounts for smoothed momentum and directional context.

  • Clean visual reading: Concentrates three layers of analysis into two lines, without arrows or unnecessary visual clutter.

  • Identification of potential transitions: Makes it easier to spot crossovers, convergences, separations, and shifts in behavior.

  • Flexible configuration: Allows customization of periods, cycle sensitivity, weighting, regime thresholds, and calculation timeframe.

Timeframes and settings

Quorum allows you to select the calculation timeframe independently from the chart timeframe, facilitating the analysis of different market horizons. When using a higher timeframe, historical bars respect the close of the corresponding candles, while the higher-timeframe candle that is still open continues to update.

The indicator supports customizable settings for:

  • Williams %R period

  • Laguerre gamma

  • Kaufman efficiency period

  • Regime identification thresholds

  • Base weighting between extremes and cycle

  • Consensus smoothing period

  • Calculation timeframe

  • Colors and visual reference levels

Important

Quorum Oscillator is a technical analysis tool, not an automated trading system. It does not generate orders, execute trades, or use arrows to indicate entries or exits. The lines update while the current candle is open, meaning crossovers can change before the close. To evaluate a crossover as confirmed, you should wait for the corresponding candle to close.

Quorum Oscillator It’s not about adding more indicators to your chart. It’s about combining different dimensions of the market and observing when they begin to agree.
More from author
Elliott Wave Radar
Andres Felipe Carvajal Rodriguez
Elliott Wave Radar — Automatic Elliott Wave Analysis for MetaTrader 5 Elliott Wave Radar automatically identifies and analyzes potential Elliott Wave structures directly on the chart, using ATR-based pivots and structural rules to evaluate impulsive and corrective waves. How to read the chart Blue: impulsive waves 1, 3, and 5. Red: corrective waves 2 and 4. Gold zone: 50%–61.8% Fibonacci retracement while waves 2 or 4 are forming. Cyan projection: estimated wave 5 target, calculated after the en
FREE
Trend BB MACD
Andres Felipe Carvajal Rodriguez
5 (3)
Trend BB MACD with ADX Filter The Trend BB MACD with ADX Filter is an advanced technical tool that combines Bollinger Bands (BB) , MACD , and the Average Directional Index (ADX) . It now incorporates a complete directional analysis system with +DI and -DI , as well as cross-confirmation options with MACD. This tool is designed to provide precise and filtered trading signals, optimized for scalping , intraday, and swing trading. It helps identify not only the direction but also the strength and r
FREE
TDI Laguerre
Andres Felipe Carvajal Rodriguez
TDI Laguerre The TDI Laguerre is an evolution of the popular Traders Dynamic Index (TDI) indicator. It replaces the classic RSI with a Laguerre filter , offering a smoother, more sensitive, and precise reading of price action. This advanced version combines elements of volatility, moving averages, and visual signal detection with configurable alerts.  What Does This Indicator Do? This indicator displays: A smoothed Laguerre line based on the closing price. A short-term EMA signal line overlaid
FREE
BB KC Hybrid Squeeze Band
Andres Felipe Carvajal Rodriguez
5 (1)
BB KC Hybrid Squeeze Band – Advanced Volatility and Compression Indicator The BB KC Hybrid Squeeze Band is a next-generation technical indicator that intelligently combines Bollinger Bands (BB) and the Keltner Channel (KC) into a single hybrid structure. Designed to provide a more accurate reading of market volatility, compression, and expansion environments, this indicator allows for the detection of key opportunity zones with greater anticipation and less noise. What Does It Do? Dynamic Hybrid
FREE
StochWpR Momentum Oscillator
Andres Felipe Carvajal Rodriguez
5 (2)
StochW%R Momentum Oscillator – Your Smart Hybrid Momentum Indicator Precision. Noise Filtering. More Reliable. Tired of traditional oscillators generating false signals in volatile markets? The StochW%R Momentum Oscillator is the evolution in momentum analysis, combining the best of the Stochastic and Williams %R into one powerful, customizable indicator. Key Benefit: It reduces market noise and provides cleaner signals thanks to its intelligent fusion algorithm, with early alerts for trend chan
FREE
Trading Exporter for AI Assistant
Andres Felipe Carvajal Rodriguez
4 (1)
Trading Exporter for AI Assistant is a professional indicator for MetaTrader 5 designed to export comprehensive and structured trading data in JSON format. Its purpose is to enable any Artificial Intelligence (AI) assistant—whether free or paid, such as ChatGPT, Gemini, Copilot, Claude, or DeepSeek—to analyze the information and provide personalized recommendations, strategies, and explanations. Special Recommendation: DeepSeek While this exporter works with any AI, DeepSeek is especially recomm
FREE
Pro MA 5
Andres Felipe Carvajal Rodriguez
Pro MA 5 – The Professional Moving Average Suite  The Most Complete Moving Average System for MetaTrader 5 Pro MA 5 revolutionizes technical analysis by offering a powerful, customizable, and efficient interface to detect trends with surgical precision .  What is Pro MA 5? It's an advanced indicator that integrates up to 5 configurable moving averages with intelligent alerts , an interactive panel , and an optimized design for trading on any instrument or timeframe. It's an all-in-one solution
FREE
Pi Cycle Projections
Andres Felipe Carvajal Rodriguez
5 (1)
What Is Pi Cycle Projections? Pi Cycle Projections is a technical analysis indicator for MetaTrader 5 that helps identify potential changes in market direction through moving average crossovers. When projections are enabled, it also displays potential price targets and estimated dates. 1. Pi Moving Average Signals The indicator compares a fast moving average with a slow moving average calculated using the Pi multiplier. When the two averages cross on a closed candle , the indicator can generate
FREE
Laguerre RSI Classic
Andres Felipe Carvajal Rodriguez
Laguerre RSI: An Advanced Oscillator for Market Analysis The Laguerre RSI is an advanced oscillator based on digital filters, developed by John Ehlers. This indicator smooths price fluctuations using a technique called the Laguerre filter , allowing for more precise detection of overbought and oversold zones while reducing market noise. The Laguerre RSI oscillates between 0 and 1 , with standard levels set as follows: Overbought: above 0.75 Oversold: below 0.25 This indicator is ideal for detect
FREE
Virtual Candle Blocks
Andres Felipe Carvajal Rodriguez
Virtual Candle Blocks – Visualize the market without limits Virtual Candle Blocks is an advanced indicator for MetaTrader 5 that allows you to create and visualize candles of any custom timeframe, including those not natively available on the platform. Key Features: Custom Timeframes: It groups base chart candles into blocks of your desired duration (e.g., 5h, 14h, 28h, 72h, etc.) to form a new virtual candle. This gives you access to exclusive timeframes found on premium platforms like TradingV
FREE
Adaptive Fibonacci Zones
Andres Felipe Carvajal Rodriguez
The Adaptive Fibonacci Zones is an enhanced, dynamic version of the classic MetaTrader 5 Fibonacci retracement. Its main difference from the native Fibonacci tool is that you don't need to manually draw the levels or subjectively decide where to measure the retracement from. The indicator does this work for you: it automatically detects relevant market swings (highs and lows) using fractals and an ATR-based volatility filter. This way, the Fibonacci adapts to the market in real time, displaying
FREE
MultiFrame Momentum
Andres Felipe Carvajal Rodriguez
MultiFrame Momentum Indicator The MultiFrame Momentum is an advanced indicator that simultaneously analyzes multiple market timeframes to identify moments of directional convergence . Its unique design seeks momentum coincidences across different timeframes, generating clear visual signals via a line that changes between green (bullish) , red (bearish) , and gray (neutral) . Essential Configuration and Testing The indicator's effectiveness is entirely dependent on the customized timeframe config
FREE
Projective SR
Andres Felipe Carvajal Rodriguez
5 (1)
Projective SR - Real-Time Projected Support and Resistance Projective SR is an advanced indicator that automatically detects key support and resistance points on the chart and projects them diagonally and dynamically into the future , anticipating potential areas where the price might react. Unlike traditional indicators that only show static, fixed levels, Projective SR analyzes price geometry , identifies the most relevant pivots, and draws sloping lines that adapt to market movement. These li
FREE
Correlation Nexus
Andres Felipe Carvajal Rodriguez
Correlation Nexus Correlation Nexus: Master the Direct or Inverse Relationship Between Pairs Correlation Nexus is an advanced technical indicator for MetaTrader 5 that detects trading opportunities based on the statistical correlation between two financial instruments. This system allows traders to profit from both positive (direct) correlations and negative (inverse) correlations , adapting dynamically to different currency pairs, indices, or commodities. Unlike conventional tools, this indicat
FREE
Theme Switcher
Andres Felipe Carvajal Rodriguez
Theme Switcher - Personalize Your Trading Terminal Description The Theme Switcher is an interactive panel that lets you quickly change the color scheme of your MetaTrader 5 chart. Designed for traders seeking a comfortable and personalized visual environment, This tool offers a variety of theme styles inspired by brands, movies, and professional designs. How to Use It Open the panel: Simply add the indicator to your chart, and a window with buttons for different themes will appear. Select a them
FREE
Scalping Timer
Andres Felipe Carvajal Rodriguez
Scalping Timer – Real-Time Precision for Demanding Scalpers Scalping Timer is a compact visual indicator designed specifically for scalpers and day traders who rely on perfect timing and minimum transaction costs . This real-time panel displays two essential metrics for scalping: Exact countdown of the remaining time until the candle closes as set on the chart. Immediate visualization of the current symbol's spread. With this critical information at your fingertips, you can anticipate sharp move
FREE
Trading Advisor a Helping Hand
Andres Felipe Carvajal Rodriguez
Trading Advisor - A Helping Hand This indicator is designed to advise and support traders in their operations, offering real-time quantitative market analysis. It is not an automated decision-making tool, but an intelligent assistant that provides: Market diagnosis (bullish/bearish trend, range, volatility) General recommendations (when to buy, sell, or wait) Suggested risk management (Stop Loss and Take Profit based on ATR) Psychological tips for maintaining discipline It's ideal for traders lo
FREE
LCD Laguerre Convergence Divergence
Andres Felipe Carvajal Rodriguez
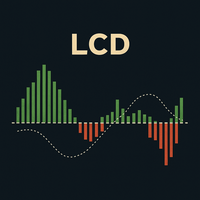
The LCD Laguerre Convergence Divergence is a momentum oscillator based on the logic of the classic MACD. It includes a fast line, a signal line, and a histogram, but replaces exponential moving averages with four-pole Laguerre filters and expresses its values in ATR multiples. This provides a comparable scale across different assets, including Forex, gold, and indices. Its main advantage is its ability to adapt to volatility. The gamma parameter controls filter responsiveness: lower values reac
FREE
Hourly Bias Scanner
Andres Felipe Carvajal Rodriguez
Discover the secrets big players don't want you to see. Have you ever wondered if the market's "whales" always enter at the same time and in the same direction? This indicator shows you. It doesn't give entry signals, but it reveals historical patterns of movement by hour or day that would normally go unnoticed. For example, you could discover that on Thursdays at 3:00 PM, EURUSD has an 80% probability of moving upwards . It's ideal for traders who want to confirm hourly biases or identify high
FREE
SOS Trader
Andres Felipe Carvajal Rodriguez
This indicator is an advanced loss position monitor, designed to help you react in time and protect your capital. It analyzes all open trades on the current symbol in real-time, calculates volatility using ATR on multiple timeframes, and determines how close the price is to your Stop Loss. It displays visual lines ( dynamic Stop Loss and Break-Even ) and a Bloomberg-style panel with key information for each trade: Loss percentage relative to your balance Distance to Stop Loss in pips and ATR mul
FREE
Real Time Synthetic FX Rate
Andres Felipe Carvajal Rodriguez
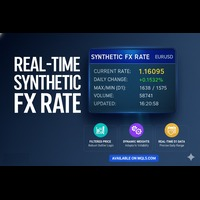
Real-Time Synthetic FX Rate Real-Time Synthetic FX Rate is an advanced indicator designed to calculate a robust, synthetic exchange rate estimate for any currency pair available on your broker (including Majors, Minors, and Exotics). Its goal is to offer a dynamic reference that reflects price formation minute-by-minute , providing an orientational guide before the publication of official rates or institutional validations. How It Works: The Robust Hybrid Model The indicator generates its synthe
FREE
Alert Signal Chess King Trading Opening
Andres Felipe Carvajal Rodriguez
"The Chess Strategy Applied to Forex Trading" Imagine the market as a chessboard. Each technical indicator is a unique and powerful piece, with its own distinct function. This intelligent system combines six key "pieces" that work in harmony to detect high-probability entry signals: Pawn (EMA 50): Your nimble scout, detecting rapid changes in the short-term trend. Rook (EMA 200): A steadfast fortress, confirming the overarching major market trend. Knight (Bollinger Bands): Agile and unpredictab
Advanced ADX Pro
Andres Felipe Carvajal Rodriguez
Advanced ADX Pro: Take Your ADX Analysis to the Next Level  The Advanced ADX Pro is an advanced trading tool designed to transform your experience with the traditional Average Directional Index (ADX) indicator. Created to offer greater convenience, control, and visual and auditory clarity, this indicator goes far beyond the capabilities of MetaTrader 5's (MT5) native ADX.  What is ADX and Why is it Crucial? The ADX is a vital technical indicator that measures the strength of the market trend . I
MarketCrack Whale Detector
Andres Felipe Carvajal Rodriguez
MarketCrack – Whale Detector Identify market pressure and verify whether price is actually moving in that direction. MarketCrack – Whale Detector is a multi-timeframe analysis panel that measures buying and selling pressure and checks whether the move has genuine follow-through. It combines the close position within each candle, relative volume, movement range, and trend direction. This allows it to distinguish between a push that successfully drives price forward and pressure that fails to pr
GoGo Breaker The Master Candle Signal
Andres Felipe Carvajal Rodriguez
GoGo Breaker – The Master Candle Signal Smart Signals Based on Price Action with Advanced Filters GoGo Breaker is a powerful trading indicator that uses the "Master Candle" pattern to identify high-probability opportunities in real-time. Designed for traders seeking fast and precise entries , it is ideal for scalping, intraday, and swing trading . Automatically detects buy/sell signals with clear arrows. Works in all markets: Forex, indices, commodities, and cryptocurrencies. Flexible: Can be us
Smart Volume Flow
Andres Felipe Carvajal Rodriguez
Smart Volume Flow The Smart Volume Flow is a professional volume analysis tool that takes order flow interpretation to a higher level. It's designed to go beyond simple bar counting by combining hybrid volume , trend context , multi-timeframe filters , and directional strength validation (ADX and +DI/-DI) . Its goal is to dissect, weight, and contextualize market activity, transforming raw data into tactical information for more precise decision-making. What Makes It Different? Unlike MetaTrader
Legion of Soldiers
Andres Felipe Carvajal Rodriguez
LEGION OF SOLDIERS – Trend Re-Entry and Momentum Indicator for MT5 Identify re-entry opportunities. Follow the direction of your trading strategy. LEGION OF SOLDIERS is a technical analysis indicator for MetaTrader 5 designed to help identify potential re-entry opportunities within an existing market trend. It combines two lines with different response speeds and a central pressure histogram to visualize momentum, line crossovers, and market activity based on volume and volatility. This indicato
Oracle Oscillator
Andres Felipe Carvajal Rodriguez
Here is the coherent translation of the text into English: The Oracle Oscillator is a true revolution in technical analysis. Instead of forcing the trader to watch multiple oscillators at the same time—like RSI, Stochastic, Williams %R, DeMarker, and the Laguerre Filter—this indicator unifies the best of each into a single hybrid line (DodgerBlue color), perfectly calibrated to be reactive to real movements while filtering out market noise , thus avoiding the false impulses that confuse so many
Dragon Bands Z
Andres Felipe Carvajal Rodriguez
DRAGON BANDS Z – Market Trend and Consensus Indicator Identify Market Direction Through Multi-Indicator Consensus. DRAGON BANDS Z is a technical analysis indicator designed to help traders identify market direction, assess trend strength, and detect periods of low directional momentum or conflicting market conditions. It combines multiple technical indicators into a single visual channel, making market conditions easier to interpret without displaying the individual source indicators on the char
HeatMap Regression Confluence
Andres Felipe Carvajal Rodriguez
HEATMAP REGRESSION CONFLUENCE – Your Price Magnet Radar Identify potential price magnets left behind by strong market movements. HeatMap Regression Confluence is a technical indicator designed to identify price gaps left behind by strong impulsive movements. These areas can act as potential price magnets, attracting the market back toward levels where trading activity was previously limited. Instead of displaying traditional rectangles or cluttering the chart with multiple signals, the indicato
Filter:
No reviews
Reply to review