ETs signals
- Indicators
-
ANDREA DELUGAS
 # 👨💼 Il Trader Dietro E.T.S. Prediction Pro
## Dalla Passione per i Numeri all'Edge Quantitativo
---
### Chi Sono - Version: 1.10
- Updated: 30 September 2026
- Activations: 5
ETS Prediction – Return to equilibrium
📌 Important note for using ETS Signals
To receive signals for the instruments you want to trade, you need to add them manually inside the indicator.
🔹 How to do it:
-
Open the ETS Signals indicator on your chart
-
Go to settings
-
In the instruments section, manually enter the symbols you want to monitor (e.g. EURUSD, XAUUSD, NAS100, etc.)
-
Save and you're done
⚠️ Without this step, the indicator will not generate signals for instruments that haven't been added.
If you have any doubts about how to add the symbols, feel free to contact me and I'll help you. ✅
🇨🇳 中文
📌 使用 ETS Signals 的重要提示
要接收您想交易的品种信号,您需要手动添加这些品种到指标中。
🔹 操作步骤:
-
在图表上打开 ETS Signals 指标
-
进入设置
-
在品种栏目中,手动输入您想监控的符号(例如 EURUSD、XAUUSD、NAS100 等)
-
保存即可
⚠️ 如果不进行此操作,指标将不会为未添加的品种生成信号。
如果您对如何添加符号有疑问,欢迎随时联系我,我会帮助您。✅
🇷🇺 Русский
📌 Важное примечание по использованию ETS Signals
Чтобы получать сигналы по инструментам, которыми вы хотите торговать, необходимо добавить их вручную в индикаторе.
🔹 Как это сделать:
-
Откройте индикатор ETS Signals на графике
-
Перейдите в настройки
-
В разделе инструментов вручную введите символы, которые хотите отслеживать (например, EURUSD, XAUUSD, NAS100 и т.д.)
-
Сохраните — готово
⚠️ Без этого шага индикатор не будет генерировать сигналы по недобавленным инструментам.
Если у вас возникнут вопросы по добавлению символов, свяжитесь со мной — я помогу. ✅
🇪🇸 Español
ETS Prediction is an indicator that signals when the market may return to its equilibrium point within the next 24 hours. It does not follow the trend and does not make long-term forecasts: it focuses on what is statistically likely to happen in the short term.
The indicator is based on an analysis of energy, time and space. It monitors price tension and alerts you when the market may return to its equilibrium point. The reference percentage is 66.6%, a statistical figure that can represent an operational advantage.
ETS Prediction works on all time frames and adapts to different trading styles. The best results are obtained on the daily and weekly charts, where intraday noise is filtered out and signals are more reliable for larger operations.
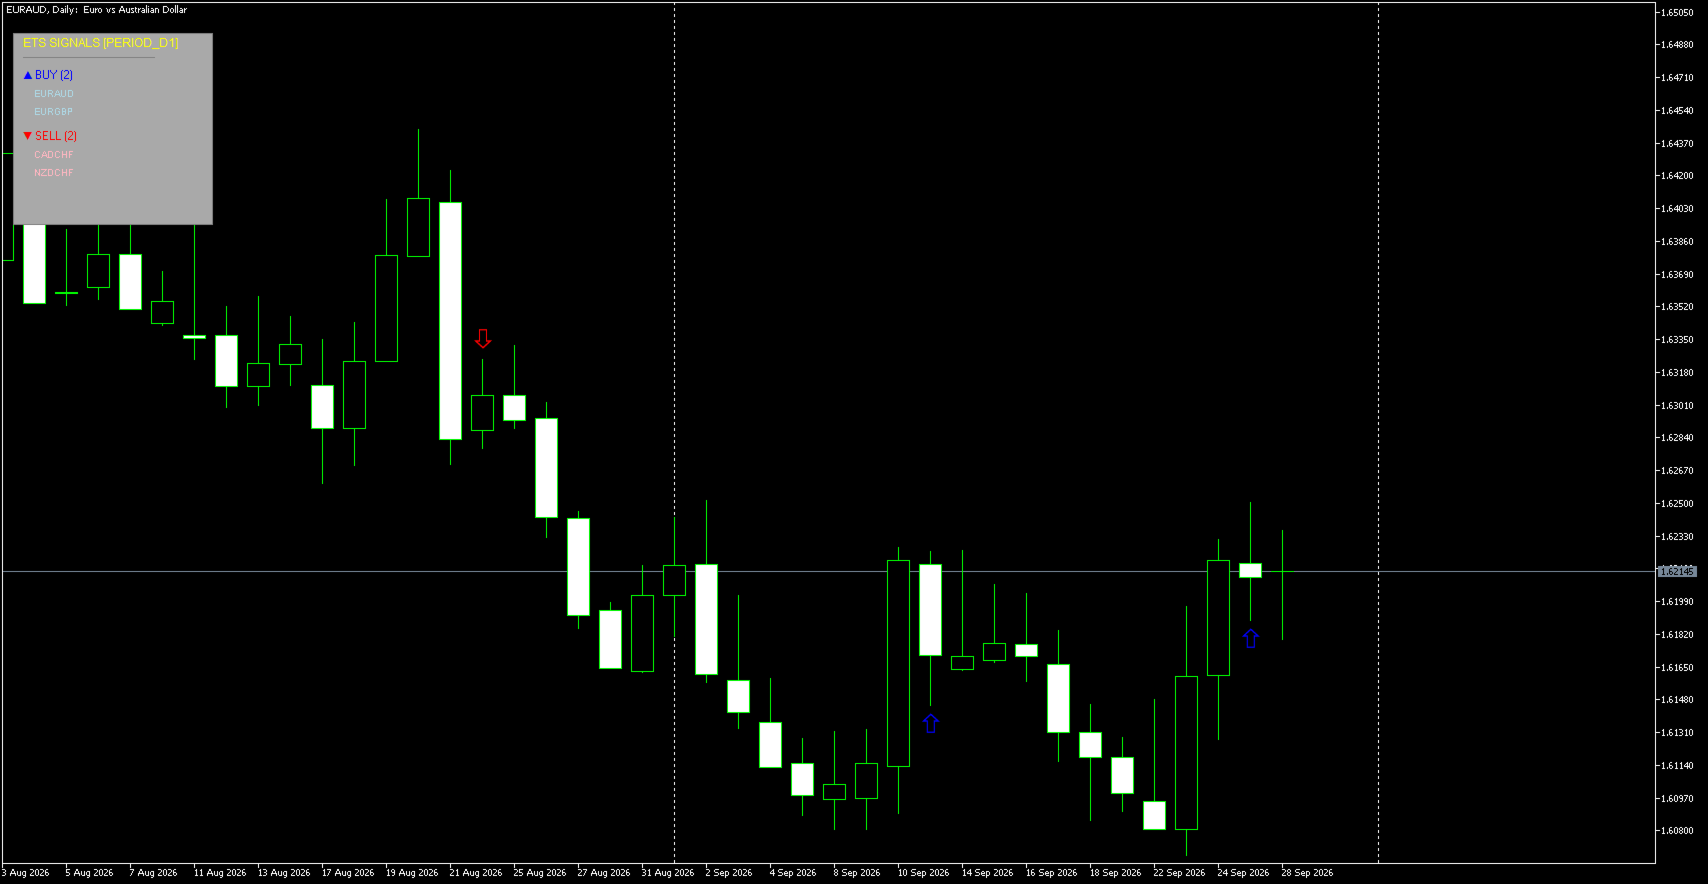
On the chart you will see blue arrows and red arrows. Blue arrows indicate a possible buying opportunity. Red arrows indicate a possible selling opportunity. In both cases, the market has a statistical probability of returning in the indicated direction within 24 hours.
The arrow may appear and disappear while the candle is forming. This happens because the algorithm reacts in real time to price movements. Only at the final close of the candle does the signal confirm and become operational for the next candle. To trade more safely, it is advisable to wait for the candle to close. Once closed, the arrow remains fixed.
The practical advantages are simple. You no longer need to stare at the chart for hours, because the indicator alerts you when there is an opportunity with statistical probability. You can scan multiple assets and look for rebound opportunities. The strategy is clear: buy on the blue arrow, sell on the red arrow. The market may return to its equilibrium. You can also adapt the indicator to your trading style.
ETS Prediction is aimed at intraday traders who want to identify movements back to the average price, rebound traders who operate on overbought or oversold levels, swing traders and position traders who prefer the daily and weekly charts, and anyone who wants a simple system: enter on the signal, exit within 24 hours.
The code is native MQL5, optimized and non-repainting on candle close. Once the candle closes and the arrow confirms, it stays there. No surprises, just statistics.