Market Condition Evaluation based on standard indicators in Metatrader 5 - page 63
You are missing trading opportunities:
- Free trading apps
- Over 8,000 signals for copying
- Economic news for exploring financial markets
Registration
Log in
You agree to website policy and terms of use
If you do not have an account, please register
Just want to say more about patterns ... about Triangle Patterns - look at this image :
Forum
Market Condition Evaluation based on standard indicators in Metatrader 5
newdigital, 2013.02.19 13:47
This is whole the thread about breakout :)
Breakout may be catchen
All the indicators with templates were uploaded to thisthread as the links to CodeBase and so on.
As to previous image - I described that I am not professional with patterns but it is some kind of price pattern when trendlines are creating criss-cross. if they price will create this criss-cross from up to down so it will be downtrend (may be - breakdown), if the price will break this criss-cross from down to up so it may be good uptrend.
I am trading those breakout/breakdown on the other thread uploading the results. And I keep this thread just for market condition evaluation only.
As I said many times - I am not professional with patterns. Some members asked me to open separated thread about patterns but I am sorry - I am just learning patterns.
Thus, the following 3 posts will be from this source.
3 Easy Triangle Patterns Every Forex Trader Should Know - Symmetrical Triangle
The first type of pattern is the symmetrical triangle pattern. It is formed by two intersecting trendlines of similar slope converging at a point called the apex.
In the above example of a symmetrical triangle you can easily see on the AUDUSD 1-Hour chart the intersection of a rising trendline and a downtrend line at the bottom of a larger trend. Sellers are unable to push prices lower and buyers can’t push price to new highs.
3 Easy Triangle Patterns Every Forex Trader Should Know - Ascending Triangle
The next type of triangle pattern is the ascending triangle. It is easily recognized by a rising trend line intersecting with a flat resistance line. It is often regarded by traders as a bullish pattern characterized by a breaking out above resistance when completed. However, in the ascending triangle pattern, breakouts can take place below resistance. This can especially be the case when the trend prior to the triangle was down.
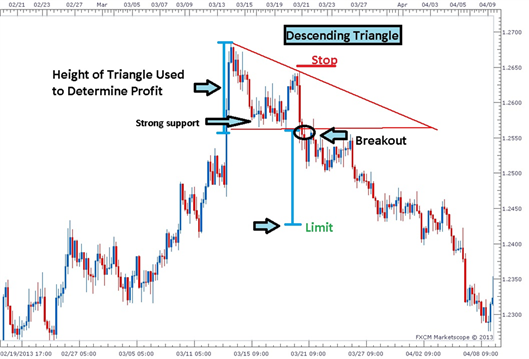
3 Easy Triangle Patterns Every Forex Trader Should Know - Descending Triangle
The last triangle pattern is the descending triangle pattern. The descending triangle is characterized by an area of strong support intersecting a downward sloping trend line. When chartist see this pattern as part of a larger downtrend, they look for a continuation of the downtrend. A close break and close below the area of support would be a confirmation of this pattern signaling traders to enter short with a stop above the top of the pattern.
The next question - how to draw those triangle patterns? Manually, or we are having some indicator for that? We are having indicator - Maksigen indicator. read more here:
================================
MaksiGen trading system
================================
MTF systems================================
MetaTrader Trading Platform Screenshots
GBPUSD, M5, 2013.09.06
MetaQuotes Software Corp., MetaTrader 5, Demo
31 pips movement by GBP - Consumer Inflation Expectations
Forum
Press review
newdigital, 2013.09.06 12:46
2013-09-06 08:30 GMT (or 10:30 MQ MT5 time| [GBP - Consumer Inflation Expectations]If actual > forecast = good for currency (for GBP in our case)
==========
U.K. Inflation, Rate Hike Expectations Fall: BoE Survey
Britons' inflation expectations have eased from May and the proportion of respondents expecting an interest rate hike in the next 12 months was the lowest since 2008, results of a key survey from the Bank of England revealed on Friday.
Median expectations of the rate of inflation over the coming year were 3.2 percent, which was lower than the 3.6 percent predicted in May, the Bank of England/GfK NOP Inflation Attitudes August Survey showed.
Respondents saw the current inflation rate at 4 percent versus 4.5 percent in May. Inflation is expected to reach 3 percent in two years and 3.5 percent in five years time.
The survey was carried out among 2050 people aged 16 and over, between August 8 and 13, which was immediately after the Monetary Policy Committee's forward guidance announcement under the new governor Mark Carney.
Forum
Press review
newdigital, 2013.09.09 15:32
2013-09-09 12:30 GMT (or 14:30 MQ MT5 time| [CAD - Building Permits]
If actual > forecast = good for currency (for CAD in our case)
==========
USD/CAD falls to 3-week low after Canadian data
The Loonie strengthened and dragged USD/CAD to a fresh 3-week low after data showed Canadian building permits grew much more than anticipated in July.
MetaTrader Trading Platform Screenshots
USDCAD, M5, 2013.09.09
MetaQuotes Software Corp., MetaTrader 5, Demo
CAD : 13 pips movement during Building Permits news event
MetaTrader Trading Platform Screenshots
USDCAD, D1, 2013.09.09
MetaQuotes Software Corp., MetaTrader 5, Demo
CAD D1
Just to remind about new Ichimoku indicator which can be downloaded from here
Forum
Market Condition Evaluation based on standard indicators in Metatrader 5
newdigital, 2013.06.28 18:00
Hi zeno,
as to lower timeframe ... the default settings of Ichimoku is 9/26/52, right? But it is mainly for higher timeframe (started from H1 for example). For lower timeframe - there are 2 kinds of settings:
=========
Besides, there are many signals of Ichimoku indicator to open the trades. I know about 6 signals (but it is much more signals in combination with each other):
The combination of all those 6 signals = Ichimoku indicator.
So, the request about alert ... it is the request to create alet for all those signals with combination with each other? if yes so it is big project ... I do not have the credits in my profile for all those alerts (which may be - more than 100 different variations) :) ... if you are talking about some particular signal so - it may be possible to make alert.
I am mostly using on the thread just one signal : Chikou Span crossing historical price. So, which signal to be alert?
Forum
USDJPY Technical Analysis 23.06 - 30.06 : Rally Finishing to Ranging
newdigital, 2013.06.27 12:07
Well ... what I am explaining here by text and charts - it is understandable for traders. But there are traders and coders on the forum. And I think we all know that they are using different "forex english" in some cases. So, I am just translating some terms/words I am using for technical Ichimoku analysis onto "coding english" language :) :
And just some thinking about ...
When I am talking about 'Ranging market condition' ... or 'price is inside Ichimoku cloud and it is indicating ranging condition' so i am meaning the following (look at the images) :
MetaTrader Trading Platform Screenshots
EURUSD, H4, 2013.09.10
MetaQuotes Software Corp., MetaTrader 5, Demo
EURUSD H4 - price is inside Ichimoku cloud for ranging market condition