Market Condition Evaluation based on standard indicators in Metatrader 5 - page 197
You are missing trading opportunities:
- Free trading apps
- Over 8,000 signals for copying
- Economic news for exploring financial markets
Registration
Log in
You agree to website policy and terms of use
If you do not have an account, please register
Forum on trading, automated trading systems and testing trading strategies
Press review
Sergey Golubev, 2016.11.04 13:52
Intra-Day Fundamentals - EUR/USD, USD/CAD and GBP/USD : Non-Farm Payrolls
2016-11-04 12:30 GMT | [USD - Non-Farm Employment Change]
if actual > forecast (or previous one) = good for currency (for USD in our case)
[USD - Non-Farm Employment Change] = Change in the number of employed people during the previous month, excluding the farming industry.
==========
From official report:
"Total nonfarm payroll employment rose by 161,000 in October, and the unemployment rate was little changed at 4.9 percent, the U.S. Bureau of Labor Statistics reported today. Employment continued to trend up in health care, professional and business services, and financial activities."
==========
EUR/USD M5: 20 pips range price movement by Non-Farm Payrolls news events
==========
USD/CAD M5: 65 pips range price movement by Non-Farm Payrolls news events
==========
GBP/USD M5: 25 pips range price movement by Non-Farm Payrolls news events
Forum on trading, automated trading systems and testing trading strategies
Press review
Sergey Golubev, 2016.11.05 09:38
EUR/USD Turns Lower on Lackluster NFP Data (based on the article)
"The EUR/USD continues to trade lower despite the release of lackluster NFP figures. NFP release was expected at +175k, and was released at +161k an actual. The big surprise on the day was a revision of September’s employment figures to 191k. This revision was up from the reported 156K, causing US Dollar based pairs to rally."
"Technically, the EUR/USD may be seen below being rejected from a 50% Fibonacci retracement value at 1.1108. This line has been acting as resistance now for three consecutive sessions, and is measured by taking the distance between the August 18th high at 1.1366 and the current October low of 1.0850. If prices continue to trade below this value, traders may see this rejection as the resumption of an ongoing 4th quarter downtrend. However if prices can break above this point, it may solidify a broader EUR/USD retracement."
Forum on trading, automated trading systems and testing trading strategies
USDCAD Technical Analysis 2016, 06.11 - 13.11: intra-day ranging; daily bullish, weekly bullish reversal
Sergey Golubev, 2016.11.05 18:07
Daily price is located above Ichimoku cloud in the bullish area of the chart: price is on testing 1.3433 resistance level to above for the bullish trend to be continuing.
Ascending triangle pattern was formed by the price to be crossed to above for the bullish continuation, Trend Strength indicator is estimating the trend as a primary bullish, and Absolute Strength indicator together with Chinkou Span line of Ichimoku are evaluating the trend as ranging bullish.
Anyway, Tenkan Sen line (moving average of the highest high and lowest low over the last 9 trading days. (Highest high + Lowest low) / 2 over the last 9 trading days) is already crossed with Kijun Sen line (moving average of the highest high and lowest low over the last 26 trading days. (Highest high + Lowest low) / 2 over the last 26 trading days) for the bullish trend to be continuing in the future.
If D1 price breaks 1.3277 support level on close bar so the local downtrend as the secondary correction within the primary bullish trend will be started.
If D1 price breaks 1.3005 support level on close bar so we may see the reversal of the price movement from the ranging bullish to the primary bearish market condition.
If D1 price breaks 1.3433 resistance level on close bar from below to above so the primary bullish trend will be continuing.
If not so the price will be on bullish ranging within the levels.
SUMMARY: rimary bullish market condition
TREND: bullish
Forum on trading, automated trading systems and testing trading strategies
Forecast for Q4'16 - levels for S&P 500
Sergey Golubev, 2016.11.06 08:58
S&P 500 Long-Term Technicals: weekly breakdown to secondary correction, or the bullish ranging within the narrow levels
Weekly price is located above Ichimoku cloud in the bullish area of the chart. The price is on secondary correction to be started on open weekly bar for now with the 2,056 support level to be broken for the secondary correction to be continuing. Alternative, if the price breaks 2,191 resistance level to above so the primary bullish trend will be resumed.
Trend:
W1 - bullishForum on trading, automated trading systems and testing trading strategies
EURUSD Technical Analysis 2016, 06.11 - 13.11: bear market rally to the bullish reversal or to the bearish retracement
Sergey Golubev, 2016.11.06 11:55
Daily price is located below 200-day SMA in the bearish area of the the chart. The price is on local uptrend as the bear market rally since 26 of October this year: 100-day SMA at 1.1139 is going to be broken by the price for open daily bar for now to be reversed to the ranging area of the chart located within 100 SMA/200 SMA area, and with 200 SMA level at 1.1179 as a nearest bullish reversal target in this case.
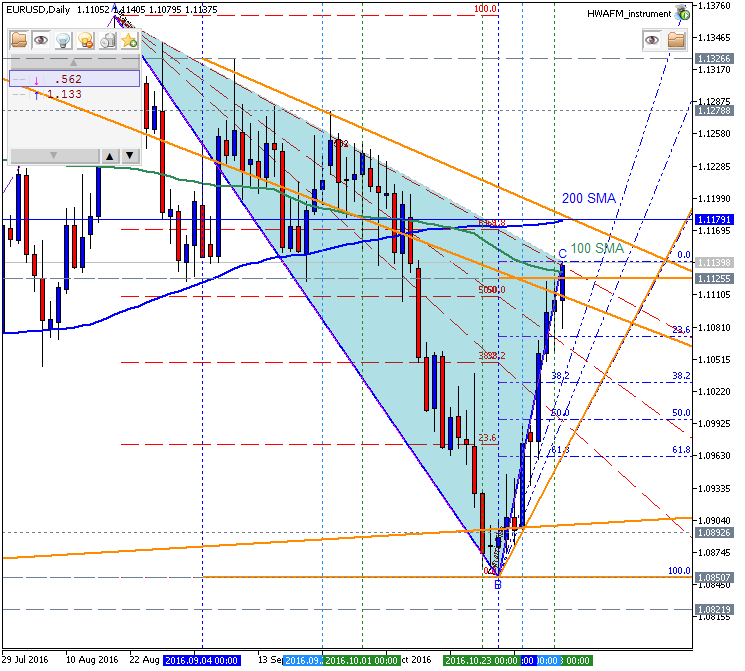
If D1 price breaks 1.0850 support level on close bar so the primary bearish trend will be resumed with 1.0821 bearish target.If D1 price breaks 1.1179 resistance level on close bar from below to above so the reversal of the daily price movement from the ranging bearish to the primary bullish market condition will be started.
If not so the price will be on bearish ranging within the levels.
SUMMARY: bearish
TREND: bear market rally
Forum on trading, automated trading systems and testing trading strategies
Press review
Sergey Golubev, 2016.11.08 06:43
USD/CNH Intra-Day Fundamentals: China Trade Balance and 29 pips range price movement
2016-11-08 02:33 GMT | [CNY - Trade Balance]
if actual > forecast (or previous one) = good for currency (for CNY in our case)
[CNY - Trade Balance] = Difference in value between imported and exported goods during the previous month.
==========
From ForexLive article: China October trade balance: CNY +325.25bn (expected CNY366.61bn, prior CNY278.35bn)
==========
USD/CNH M5: 29 pips range price movement by China Trade Balance news event
Forum on trading, automated trading systems and testing trading strategies
Press review
Sergey Golubev, 2016.11.08 10:54
GBP/USD Intra-Day Fundamentals: U.K. Factory Production and 12 pips range price movement
2016-11-08 09:30 GMT | [GBP - Manufacturing Production]
if actual > forecast (or previous one) = good for currency (for GBP in our case)
[GBP - Manufacturing Production] = Change in the total inflation-adjusted value of output produced by manufacturers.
==========
From official report:
==========
GBP/USD M5: 12 pips range price movement by U.K. Factory Production news event
Forum on trading, automated trading systems and testing trading strategies
Press review
Sergey Golubev, 2016.11.09 05:43
USD/CNH Intra-Day Fundamentals: China Producer Price Index and 299 pips range price movement
2016-11-09 01:30 GMT | [CNY - PPI]
if actual > forecast (or previous one) = good for currency (for CNY in our case)
[CNY - PPI] = Change in the price of goods purchased and sold by producer.
==========
From aastocks article: China Oct PPI Up 1.2% YoY, vs Estimates of Up 0.9%
==========
USD/CNH M5: 299 pips range price movement by China Producer Price Index news event
Forum on trading, automated trading systems and testing trading strategies
Press review
Sergey Golubev, 2016.11.09 12:26
USD/JPY after Donald Trump's victory in the U.S. election (based on the article)
USD/JPY H1 timeframe: price broke 100 SMA/200 SMA levels to below for the reversal from the primary bullish to the primary bearish market condition with 101.18 support level to be testing for the bearish trend to be continuing.
"The yen climbed from an earlier session low of 105.46 to as high as 101.15 versus the dollar. As of 5:37 a.m. ET, the dollar/yen traded at 103.18."
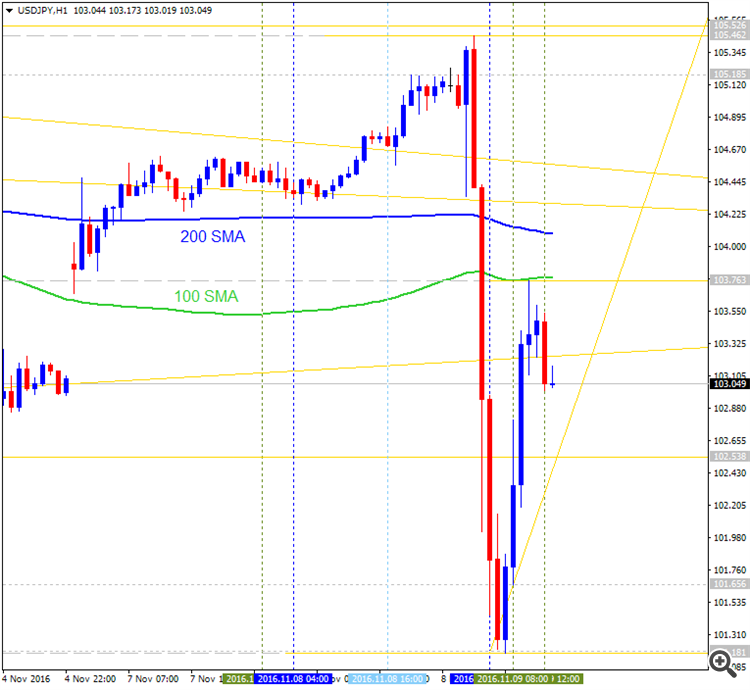
For now, the price is bearish ranging to be bounced from 100 SMA to below for the second breakdown round to be started.Forum on trading, automated trading systems and testing trading strategies
Press review
Sergey Golubev, 2016.11.09 12:16
Mexican peso plummets as Trump clinches victory (based on the article)
USD/MXN H1 timeframe: price is on breakout with the bullisgh reversal by breaking 100 SMA/200 SMA to above for the reversed from the primary bearish to the primary bullish market condition.
"The Mexican peso tumbled as the likelihood of a Trump victory increased throughout the night. The peso had been closely watched during the election campaign as a barometer of the markets' expectation of a Trump win. The peso weakened to a session low of 20.77, falling from an earlier high of 18.14. At 5:40 a.m. ET, the peso traded at 19.96 versus the dollar."
For now, the price is testing 20,7696 resistance level for the bullish trend to be continuing, otherwise - bullish ranging within the levels.