Market Condition Evaluation based on standard indicators in Metatrader 5 - page 161
You are missing trading opportunities:
- Free trading apps
- Over 8,000 signals for copying
- Economic news for exploring financial markets
Registration
Log in
You agree to website policy and terms of use
If you do not have an account, please register
Forum on trading, automated trading systems and testing trading strategies
Forecast for Q1'16 - levels for GOLD (XAU/USD)
Sergey Golubev, 2016.03.26 18:09
GOLD (XAU/USD) April Outlook - ranging bullish near the key bearish reversal level
W1 price is on primary bullish market condition with secondary ranging: the price is located above Ichimoku cloud and above Senkou Span line which is the virtual border between the primary bearish and the primary bullish trend on the chart.
If W1 price will break 1190.80 support level on close W1 bar so the reversal of the price movement from the primary bullish to the primary bearish market condition will be started with the secondary ranging: price will be located inside Ichimoku cloud.
If W1 price will break 1283.35 resistance level so the bullish trend will be continuing.
If not so the price will be on bullish ranging within the levels.
Trend:
W1 - ranging bullishForum on trading, automated trading systems and testing trading strategies
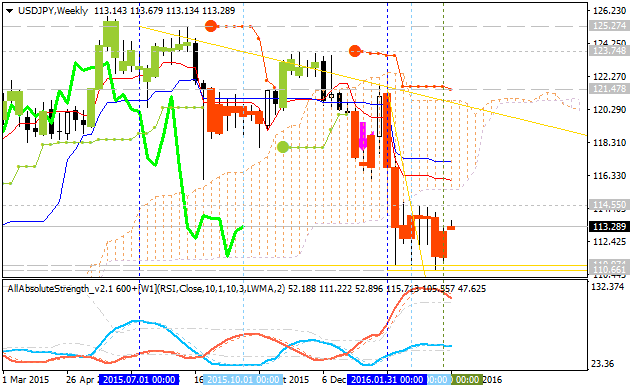
Forecast for Q1'16 - levels for USD/JPY
Sergey Golubev, 2016.03.27 09:29
USDJPY Technical Analysis 2016, 27.03 - 03.04: rally to the bullish reversal
Daily price is on bearish market condition located to be below Ichimoku cloud: the price is on secondary rally which was started in the middle of March this year.Key psy resistance level at 113.00 is going to be crossed by daily price for the rally to be continuing up to 114.87 resistance level as the next bullish reversal target. Chinkou Span line is located to be near and below the price to be ready for good possible breakout, and Absolute Strange indicator is evaluating the price movement as the secondary ranging condition to be started.
If D1 price will break 110.66 support level on close bar so the primary bearish trend will be re-started.
If D1 price will break 113.00 resistance level on close bar from below to above so the local uptrend as the bear market rally will be continuing.
If D1 price will break 114.87 resistance level on close bar so the reversal of the price movement from the primary bearish to the primary bullish market condition will be started with the secondary ranging: the price will be located inside Ichimoku cloud.
If not so the price will be on ranging within the levels.
SUMMARY : bear market rally
TREND : bearishCrude Oil Medium-Term Technical Analysis: ranging within narrow s/r levels within 100/200 SMA area
Daily price is on ranging market condition located between 100-day SMA (100 SMA) and 200-day SMA (200 SMA) within the following key support/resistance reversal levels:
RSI indicator is estimating the secondary ranging market condition.
Forum on trading, automated trading systems and testing trading strategies
Forecast for Q1'16 - levels for GBP/USD
Sergey Golubev, 2016.03.27 17:51
Quick Technical Overview: Forecasts for GBP/USD
GBP/USD. Daily price is located below 100-day SMA/200-day SMA ranging area for the bearish market condition: the price is ranging within 1.4052 support level and Fibo resistance level at 1.4534. If the price breaks 1.4052 support level to below on close daily bar so the bearish trend will be continuing; if the price breaks Fibo resistance level at 1.4534 to above so the bear market rally will be started up to the bullish reversal level at 1.4667.
There are the following news events which will be affected on GBP/USD price movement for the week:
Short-term forecast: the price will be on ranging bearish within Fibo levels.
Medium-term forecast: the key resistance at 1.4052 will be broken to below.
Long-term forecast (by year-end): price will be moved inside 1.40/1.38 s/r channel.
Forum on trading, automated trading systems and testing trading strategies
Press review
Sergey Golubev, 2016.03.28 09:12
Technical Targets for EUR/USD by United Overseas Bank (based on the article)
EUR/USD: ranging within 1.10/1.13 area for direction
H4 price is located near and above 100 period SMA and 200 period SMA for the primary bullish market condition with the secondary ranging within 1.1057 support level and 1.1342 resistance level.
RSI indicator is estimating the secondary ranging to be continuing.
Forum on trading, automated trading systems and testing trading strategies
Press review
Sergey Golubev, 2016.03.28 14:51
EUR/USD Intra-Day Fundamentals: U.S. Personal Consumption Expenditures and 12 pips price movement
2016-03-28 13:30 GMT | [USD - Core PCE Price Index]
if actual > forecast (or previous one) = good for currency (for USD in our case)
[USD - Core PCE Price Index] = Change in the price of goods and services purchased by consumers, excluding food and energy.
==========
==========
EURUSD M5: 12 pips price movement by U.S. Personal Consumption Expenditures news event :
Forum on trading, automated trading systems and testing trading strategies
Press review
Sergey Golubev, 2016.03.28 17:55
A false warning signal for the speculative JPY longs (based on the article)
BNP Paribas publish the article today about "a warning signal for the speculative JPY longs which are running at the highest level since 2011 according to our positioning indicator" - just because "Japanese investors purchasing some JPY 2.3 trn in foreign dent on the week ended March 18."
Let's evaluate this information.
Daily price. If we look at the daily chart so the price is located to be below Ichimoku cloud in the primary bearish market condition within 114.55 key bullish reversal resistance level and 110.66 key bearish continuation support level. But the price broke symmetric triangle pattern to above together with Chinkou Span line to be going to cross the price to above for good possible breakout with the reversal of the price movement to the primary bullish market condition. So, the most likely scenario for daily price is the bear market rally to be continuing with the good breakout possibility: the key resistance level at 114.55 will likely to be broken with the possible reversal to the bullish trend.
Weekly price is on bearish market condition as well to be located below ichimoku cloud for the ranging within the same key s/r levels: 114.55 and 110.66. Chinkou Span line together with Absolute Strength indicator are estimating the trend to be ranging bearish. So, there are 3 most likely scenarios for weekly price movement for the next few months:
Thus, I do not see any technical reason for such a warning which BNP Paribas made about strengthening JPY against USD: the situation is going to be made in exact opposite way: bear market rally with the possible bullish reversal for D1 timeframe, and ranging rally to be started on weekly timeframed chart for example.Forum on trading, automated trading systems and testing trading strategies
Press review
Sergey Golubev, 2016.03.29 07:39
USD/JPY Intra-Day Fundamentals: Japan Household Spending and 10 pips price movement
2016-03-29 00:30 GMT | [JPY - Household Spending]
if actual > forecast (or previous one) = good for currency (for JPY in our case)
[JPY - Household Spending] = Change in the inflation-adjusted value of all expenditures by consumers.
==========
(1) "Expenditures for Two-or-more-person Households
The average of monthly consumption expenditures per household for February 2016 was 269,774 yen, up 1.6% in nominal terms and up 1.2% in real terms from the previous year."
(2) "Income and Expenditures for Workers' Households
The average of monthly income per household stood at 478,624 yen, down 2.0% in nominal terms and down 2.4% in real terms from the previous year.
The average of consumption expenditures per household was 297,662 yen, up 2.2% in nominal terms and up 1.8% in real terms from the previous year."
==========
USDJPY M5: 10 pips price movement by Japan Household Spending news event :
Forum on trading, automated trading systems and testing trading strategies
Forecast for Q1'16 - levels for EUR/USD
Sergey Golubev, 2016.03.29 08:40
EUR/USD Intra-Day Technical Analysis - rally to the bullish reversal
M5 price is located near and below SMA with period 100 (100 SMA) and SMA with the period 200 (200-SMA): the price is on local uptrend as the bear market rally crossed 1.1193 support level together with 100 SMA to above for the ranging market condition with the possible reversal of the price movement from the primary bearish to the primary bullish market condition.
SUMMARY : ranging
TREND : waiting for directionForum on trading, automated trading systems and testing trading strategies
Press review
Sergey Golubev, 2016.03.29 16:05
GBP/USD Intra-Day Fundamentals: BoE Financial Policy Committee and 16 pips price movement
2016-03-29 11:00 GMT | [GBP - BoE Financial Policy Committee]
[GBP - BoE Financial Policy Committee] = policy changes taken and commentary about the economic conditions comments.
==========
"In an environment of low inflation and continued weakness in investment and productivity growth, prospects for global nominal growth are subdued. This raises questions about resilience to future adverse shocks, particularly for EMEs where debt levels continue to rise and terms of trade have deteriorated. In this environment, the re-acceleration of credit growth in China is concerning. In some advanced economies, lower nominal interest rates associated with weak growth prospects are restraining profitability in banking systems that are still in post-crisis repair and pose challenges for some banking business models. Globally, bank equity prices have fallen significantly and a material proportion of banks are now trading below book value."==========
GBPUSD M5: 16 pips price movement by BoE Financial Policy Committee news event :