Forecast for Q2'16 - levels for USD/JPY
USD/JPY Intra-Day Technical Analysis - waiting for for the bearish trend to be continuing or the bear market rally to be started
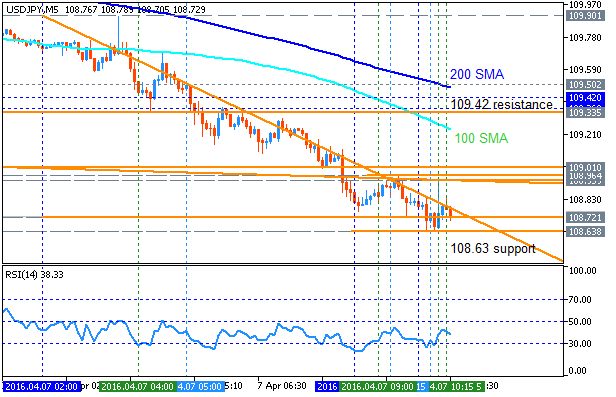
M5 price
is located below SMA with period 100 (100 SMA) and SMA with the period
200 (200 SMA) for the bearish market condition: the price is ranging within 109.01 resistance level and 108.63 support level waiting for the direction for the primary bearish trend to be continuing or the bear market rally to be started. RSI indicator is estimating the ranging bearish trend to be continuing.
- If the price will break 109.01 resistance level so the local uptrend as the bear market rally will be started.
- If the price will break 109.42 resistance level so we may see the bullish reversal of the intra-day price movement.
- If price will break 108.63 support so the bearish trend will be continuing.
- If not so the price will be ranging within the levels.
| Resistance | Support |
|---|---|
| 109.01 | 108.63 |
| 109.42 | N/A |
- Recommendation to go short: watch the price to break 108.63 support level for possible sell trade
- Recommendation to go long: watch the price to break 109.42 resistance level for possible buy trade
- Trading Summary: ranging
SUMMARY : ranging
Forum on trading, automated trading systems and testing trading strategies
Sergey Golubev, 2016.04.08 08:15
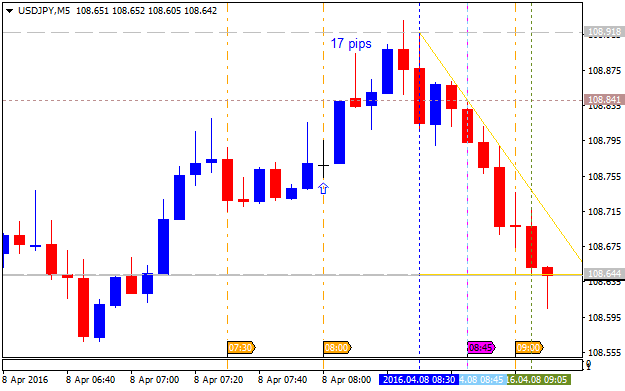
USD/JPY Intra-Day Fundamentals: Japan Consumer Confidence and 17 pips price movement
2016-04-08 06:00 GMT | [JPY - Consumer Confidence]
- past data is 40.1
- forecast data is 40.5
- actual data is 41.7 according to the latest press release
if actual > forecast (or previous one) = good for currency (for JPY in our case)
[JPY - Consumer Confidence] = Level of a composite index based on surveyed households, excluding single-person homes.
==========
- "The Consumer Confidence Index (seasonally adjusted series) in March 2016 was 41.7, up 1.6 points from the previous month."
- "The categories of the Consumer Perception Indices (seasonally
adjusted series), which are comprised of the Consumer Confidence Index
in March are as follows;
Overall livelihood: 40.5 (up 2.0 from the previous month)
Income growth: 40.6 (up 0.8 from the previous month)
Employment:43.9 (up 1.7 from the previous month)
Willingness to buy durable goods:41.7 (up 1.7 from the previous month)"
==========
USDJPY M5: 17 pips price movement by Japan Consumer Confidence news event :
Forum on trading, automated trading systems and testing trading strategies
Sergey Golubev, 2016.04.09 08:53
Naoyuki Shinohara, an ex-IMF deputy chief and formerly Japan's top currency diplomat (the articles' review)
- Tokyo unlikely to intervene in market to stem yen rises
- Conducting solo yen-selling intervention now would be ineffective, unlikely to gain G7 consent
- Hard to change with FX intervention current dollar/yen declining trend, which reflects fundamentals
- Hard to find any factors justifying yen-selling intervention
- It's clear yen isn't extremely strong on a real, effective basis
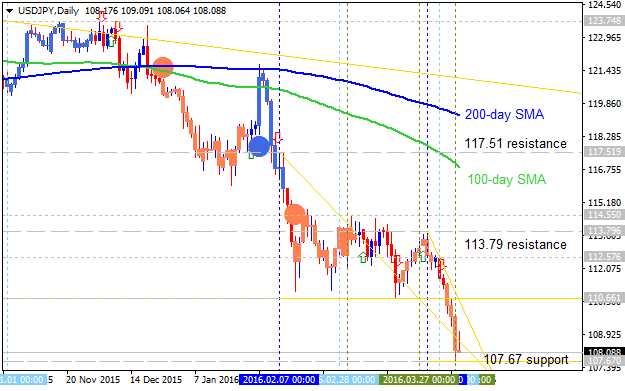
Quick Technical Overview - Sell USD/JPY: bearish breakdown
USD/JPY: bearish breakdown. The price is located to be below 100-day SMA and 200-day SMA for the primnary bearish market condition: the price is on breakdown with 107.67 support level as the tager for the bearish breakdown to be continuing if broken. Alternatively, if the price breaks 113.79 resistance level to above so the bear market rally will be started within the bearish condition with the good possibility to the reversal of the price movement to the primary bullish market condition if 117.51 resistance level will be broken to above.
There are the following news events which will be affected on USD/JPY price movement for the week:
- 2016-04-10 23:50 GMT | [JPY - Core Machinery Orders]
- 2016-04-11 13:25 GMT | [USD - FOMC Member Dudley Speaks]
- 2016-04-12 18:00 GMT | [USD - Federal Budget Balance]
- 2016-04-12 23:50 GMT | [JPY - PPI]
- 2016-04-13 12:30 GMT | [USD - Core Retail Sales]
- 2016-04-13 14:30 GMT | [USD - Crude Oil Inventories]
- 2016-04-14 12:30 GMT | [USD - Core CPI]
- 2016-04-15 02:00 GMT | [CNY - GDP]
- 2016-04-15 12:30 GMT | [USD - Empire State Manufacturing Index]
- 2016-04-15 14:00 GMT | [USD - UoM Consumer Sentiment]
| Resistance | Support |
|---|---|
| 113.79 | 107.67 |
| 117.51 | N/A |
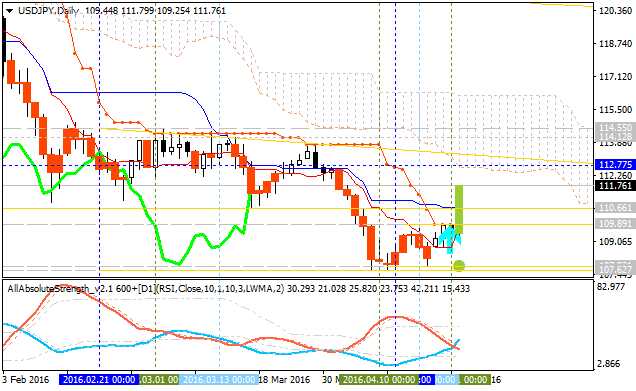
USDJPY Technical Analysis 2016, 17.04 - 24.04: bearish ranging within key narrow s/r levels
Daily price is on bearish market condition located below Ichimoku cloud and below Senkou Span line which is the virtual border between the rpimary bearish and the primary bullish trend on the chart - the price is on ranging condition within the following narrow s/r levels:
- 111.35 key resistance level located below Ichimoku cloud in the beginning of the bear market rally, and
- 107.66 key support level located below Ichimoku cloud in the primary bearish area of the daily chart.
Chinkou Span line is below the price indicating the ranging condition to be continuing by direction, Trend Strength indicator is estimating the primary bearish, and Absolute Strange indicator is evaluating the price movement as the secondary ranging condition.
If D1 price will break 107.66
support level on close bar so the bearish trend will be continuing.
If D1 price will break 111.35
resistance level on close bar from below to above so the local uptrend as the bear market rally will be started within the primary bearish market condition.
If D1 price will break 114.87
resistance level on close bar so we may see the reversal of the price movement from the primary bearish to the primary bullish trend.
If not so the price will be on ranging within the levels.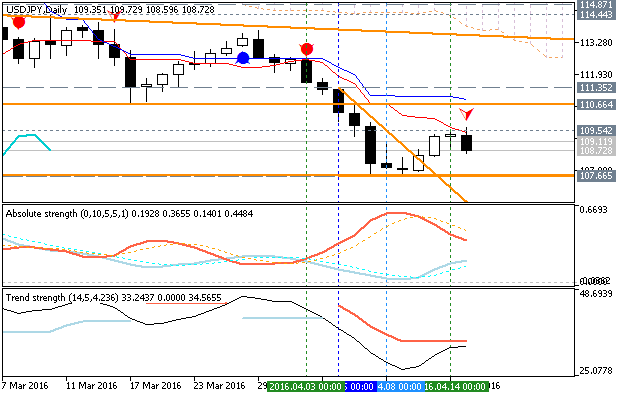
- Recommendation for long: watch close D1 price to break 111.35 for possible buy trade
- Recommendation
to go short: watch D1 price to break 107.66 support level for possible sell trade
- Trading Summary: bearish ranging
| Resistance | Support |
|---|---|
| 111.35 | 107.66 |
| 114.87 | N/A |
SUMMARY : ranging
Forum on trading, automated trading systems and testing trading strategies
Sergey Golubev, 2016.04.20 08:30
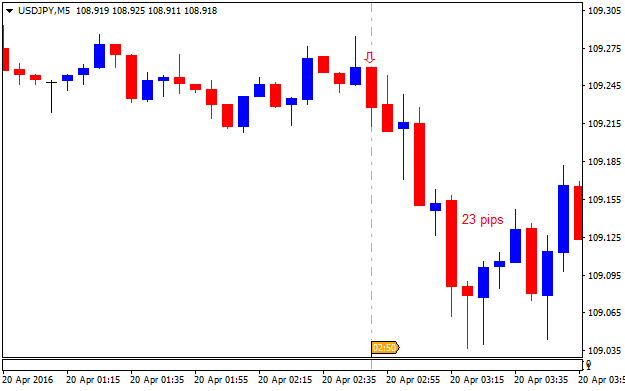
USD/JPY Intra-Day Fundamentals: Japan Trade Balance and 23 pips price movement
2016-04-19 23:50 GMT | [JPY - Trade Balance]
- past data is 0.15T
- forecast data is 0.45T
- actual data is 0.28T according to the latest press release
if actual > forecast (or previous one) = good for currency (for JPY in our case)
[JPY - Trade Balance] = Difference in value between imported and exported goods during the reported month.
==========
USD/JPY M5: 23 pips price movement by Japan Trade Balance news event :
Weekly Forecast: the most interesting pair you can make money with - USD/JPY
USD/JPY: possible breakout with bullish reversal. The pair is on breakout which was started on Friday - the price broke 2 key resistance levels on open daily bar testing 112.77 resistance level to above for the breakout to be continuing. There are 4
simple scenarios for the price movement for the week:
- breakout will be continuing in case the price breaks 112.77 resistance,
- breakout with bullish reversal to be started in case the price breaks 114.55 resistance level to above,
- the primary bearish trend will be continuing in case the price breaks 107.62 support level to below,
- or the ranging within the levels.
Chinkou Span line is crossing the price to above on open daily bar together with Absolute Strength indicator estimating the breakout to be continuingn in the near future.
There are the following news events which will be affected on USD/JPY price movement for the week:
- 2016-04-24 23:50 GMT | [JPY - SPPI]
- 2016-04-26 12:30 GMT | [USD - Core Durable Goods Orders]
- 2016-04-26 14:00 GMT | [USD - CB Consumer Confidence]
- 2016-04-27 04:30 GMT | [JPY - All Industries Activity]
- 2016-04-27 18:00 GMT | [USD - Federal Funds Rate]
- 2016-04-27 23:30 GMT | [JPY - National Core CPI]
- 2016-04-27 23:50 GMT | [JPY - Retail Sales]
- 2016-04-28 05:00 GMT | [JPY - Bank of Japan Report]
- 2016-04-28 12:30 GMT | [USD - GDP]
| Resistance | Support |
|---|---|
| 112.77 | 107.62 |
| 114.55 | N/A |
Forum on trading, automated trading systems and testing trading strategies
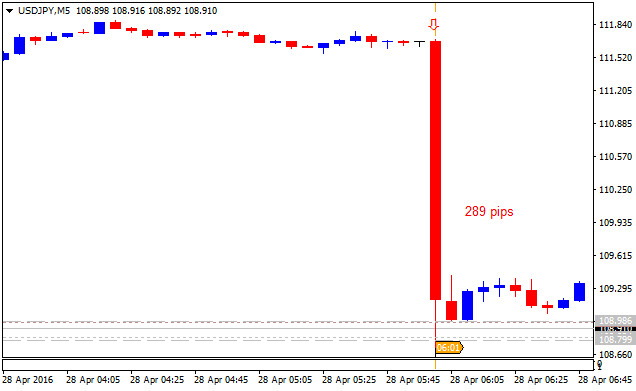
Sergey Golubev, 2016.04.28 07:54
USD/JPY Intra-Day Fundamentals: Japan Monetary Policy Statement and 289 pips price movement
2016-04-28 03:01 GMT | [JPY - Japan Interest Rate Decision]
- past data is -0.10%
- forecast data is -0.10%
- actual data is -0.10% according to the latest press release
if actual > forecast (or previous one) = good for currency (for JPY in our case)
==========
"The yen jolted nearly 200-pips higher versus the American dollar in a knee-jerk reaction to the BOJ policy announcement,
as the central bank keeps monetary policy steady, maintains 80 trln Yen
base money target and 0.1% negative interest rate. USD/JPY plunged to
fresh one-week lows of 108.78 immediately after the BOJ decision, before
recovering some ground to now trade around 109.25, still down –2.03% on
the day."
"The Japanese currency received a huge boosts as markets
were expecting more easing from the BOJ in wake of the recent
appreciation in the yen against the greenback and underlying subdued
price trends. However, markets were disappointed as BOJ decided to adopt
loan support programme only for banks in areas hit by southern Japan
quake."
==========
USD/JPY M5: 289 pips price movement by Japan Monetary Policy Statement news event :
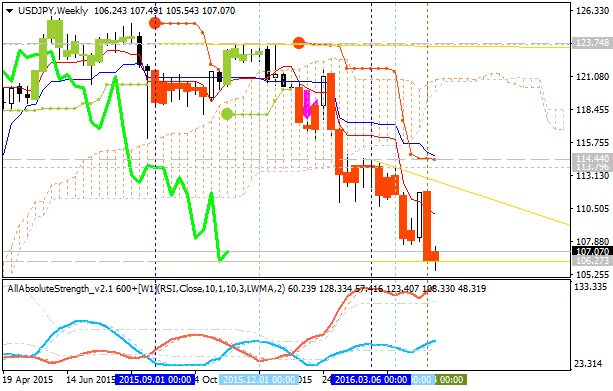
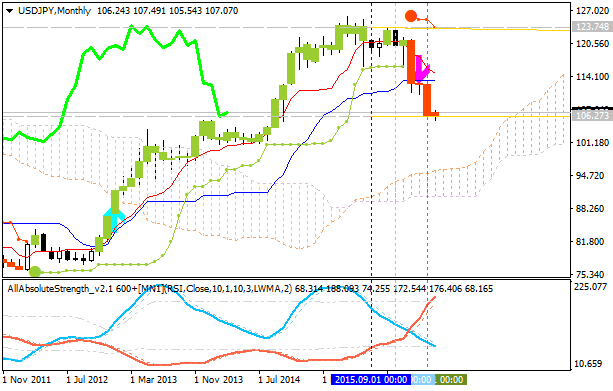
USD/JPY Technical Analysis 2016, 08.05 - 15.05: daily bearish within narrow levels; weekly bearish breakdown; monthly correction; 106.27 is the key
The Short-Term situation. Daily price was on the bearish breakdown since end of April this tear: price broke key support levels to below on the way to go to downtrend which was started from Senkou Span line and stopped by 106.27 support level. For now, the price is on narrow ranging within the following s/r levels:
- 108.19 key resistance level located above Ichimoku cloud on the border between the ranging bearish and bear market rally, and
- 106.27 key support level located far below Ichimoku cloud in the primary bearish area; if price breaks this level to below so the bearish trend will be continuing with 105.54 level as the next bearish target.
If D1 price will break 106.27
support level on close bar so the primary bearish trend will be continuing with 105.54 nearest target to re-enter.
If D1 price will break 108.19
resistance level on close bar so the local uptrend as the bear market rally will be started.
If not so the price will be on ranging within the levels.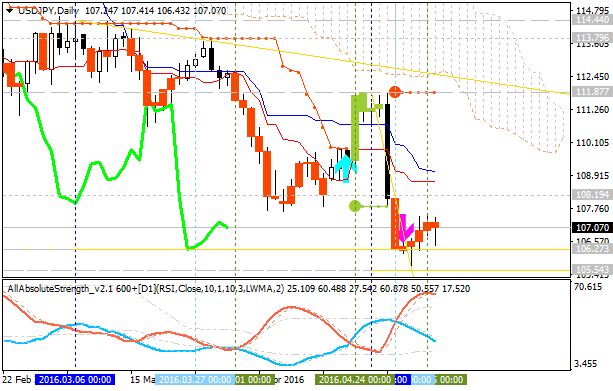
- Recommendation for long: watch close D1 price to break 108.19 for possible buy trade
- Recommendation
to go short: watch D1 price to break 106.27 support level for possible sell trade
- Trading Summary: ranging bearish
| Resistance | Support |
|---|---|
| 108.19 | 106.27 |
| 111.87 | 105.54 |
The Medium-Term situation. Weekly price is on the bearish breakdown since end of January this year: price broke key support levels together with Ichimoku cloud to below with 106.27 support level to be tested for the bearish breakdown to be continuing.
The Long-Term situation. Monthly price is on secondary correction which was started in the beginning of February this year with 106.27 support level testing for the correction to be continuing.
Forum on trading, automated trading systems and testing trading strategies
Sergey Golubev, 2016.05.09 08:17
Soros Chart Signals BOJ Bond Buying Already Enough to Weaken Yen (based on the article)
"The Bank of Japan’s bond buying has nearly trebled the monetary base in just over three years to more than 386 trillion yen ($3.6 trillion) as of April, a central bank report showed Friday. Base money in dollar terms is at its highest relative to the U.S. since 2006 at 96 percent, despite Japan’s economy being about a quarter the size. Some traders have dubbed the ratio a “Soros Chart,” after billionaire investor George Soros correctly predicted in the 1990s that burgeoning supplies of funds would weaken the yen."
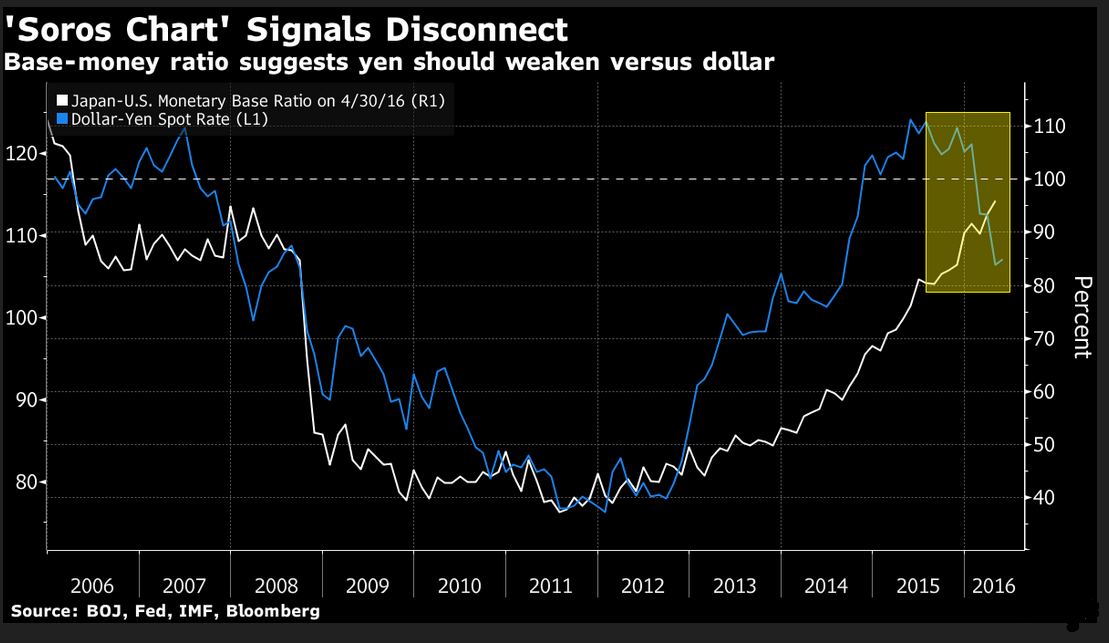
"An expanding monetary base is a factor for yen weakness, making it hard to imagine that the one-way strength that we’ve seen in the yen will continue,” said Fumio Nakakubo, chief investment officer for Japan at UBS Group AG’s wealth management unit. “There is an excess of yen in the market -- like how juice gets diluted by adding too much water -- and it will cause the yen’s value to drop further and further.”
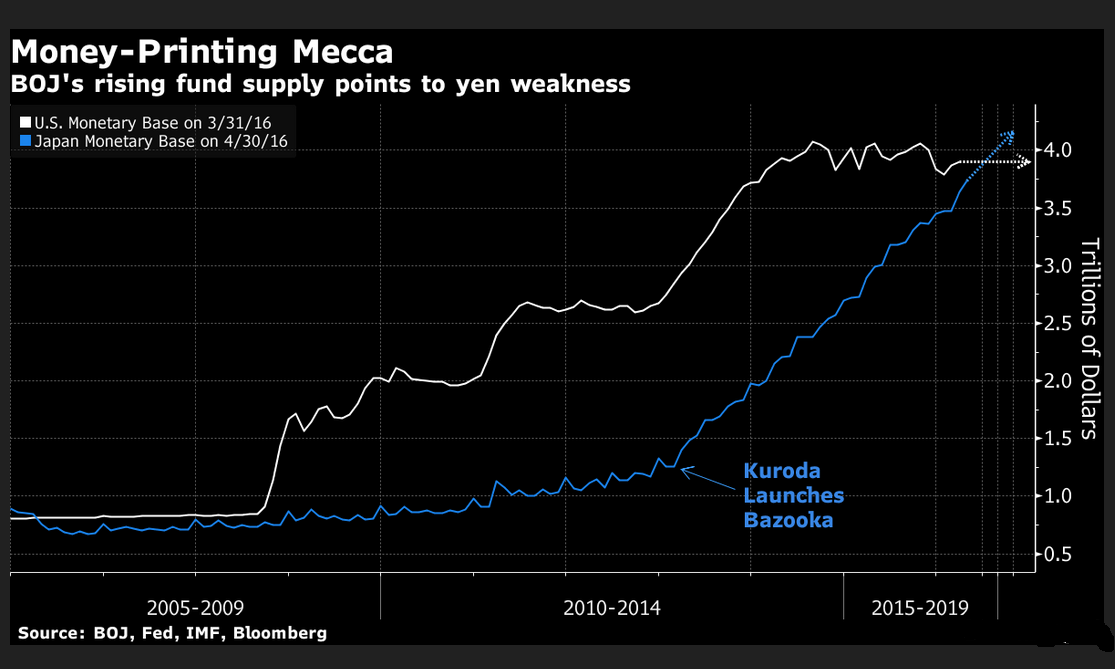
- "The BOJ is expanding the monetary base at an annual pace of 80 trillion yen, whereas the Federal Reserve wound down its own quantitative easing program in October 2014."
- “The market wants a quick fix, but the BOJ is doing everything it can,” said Daisaku Ueno, chief currency strategist at Mitsubishi UFJ Morgan Stanley Securities Co. “In the long run, it’s difficult to imagine the effect won’t be felt in the value of the yen.”
- Free trading apps
- Over 8,000 signals for copying
- Economic news for exploring financial markets
You agree to website policy and terms of use
Forum on trading, automated trading systems and testing trading strategies
Press review
Sergey Golubev, 2016.04.02 09:21
Fundamental Weekly Forecasts for GBPUSD, USDJPY, AUDUSD, USDCAD and GOLD (based on the article)
USD/JPY - "We may continue to see capital flow out of Japan which itself will keep pressure on the JPY exchange rate. The USD/JPY in particular seems likely to test near-term lows, but that is just as easily a function of US Dollar weakness instead of Yen strength. It would take a fairly significant shift in Bank of Japan policy to improve outlook for the domestic currency."