Market Condition Evaluation based on standard indicators in Metatrader 5 - page 168
You are missing trading opportunities:
- Free trading apps
- Over 8,000 signals for copying
- Economic news for exploring financial markets
Registration
Log in
You agree to website policy and terms of use
If you do not have an account, please register
Forum on trading, automated trading systems and testing trading strategies
Press review
Sergey Golubev, 2016.04.19 08:11
Technical Intra-Day Targets for EUR/USD by United Overseas Bank (based on the article)
EUR/USD: ranging within 1.1233 and 1.1331
H4 price is located near and below 100 period SMA (100 SMA) and above 200 period SMA (200 SMA) for the ranging market condition: the price is testing 1.1331 level to above for the bullish reversal, alternative - if the price breaks 1.1233 support level to below so the bearish reversal will be started.
Anyway, UOB is still looking for the bearish trend for this pair in intra-day basis, for example:
"There is no change to our bearish view but as highlighted previously, downward momentum is not very strong and the downside potential is likely limited to 1.1145. Stop-loss remains unchanged at 1.1395 but 1.1350 is already a strong short-term resistance."
RSI indicator is estimating the ranging bullish trend to be continuing.
Forum on trading, automated trading systems and testing trading strategies
Press review
Sergey Golubev, 2016.04.19 08:26
Technical Intra-Day Targets for GBP/USD by United Overseas Bank (based on the article)
GBP/USD: bullish breakout with 1.4347 as the target to be continuing
H4 price broke 100 SMA/200 SMA reversal area to above by good breakout: the price is testing 1.4347 resistance level for the bullish trend to be continuing, otherwise the price will be ranging within 1.4347 bullish resistance level and 1.4040 bearish support level. By the way, UOB is evaluating the trend for this pair as a neutral with 1.4000/1.4350 range:
"Improving short-term momentum suggests that a test of the top-end of our expected 1.4000/1.4350 range will not be surprising. However, the overall outlook is mixed and even a break above 1.4350 is not expected to move significantly above the late March high of 1.4455/60."
RSI indicator is estimating the ranging bullish trend to be continuing.
Forum on trading, automated trading systems and testing trading strategies
Forecast for Q2'16 - levels for GBP/USD
Sergey Golubev, 2016.04.19 20:49
Anyway, if we see from intra-day price movement for GBP/USD H4 for example so the bullish breakout is continuing with new target for now: 1.4418. It means the following: if the price breaks this level so the primary bullish trend will be continuing, otherwise - bullish ranging within the levels.
If we look at the daily price (GBP/USD D1) so this resistance level at 1.4418 is not significant one. WHy? because as we see from the chart below - this is bullish reversal breakout is going on for now on open daily bar:
Forum on trading, automated trading systems and testing trading strategies
Press review
Sergey Golubev, 2016.04.20 09:16
Trading News Events: U.K. Jobless Claims Change (based on the article)
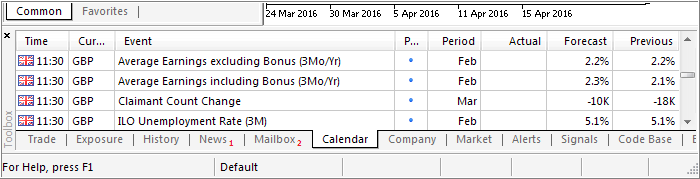
What’s Expected:
Even though the Bank of England (BoE) remains upbeat on the U.K. economy, signs of weak wage growth may encourage Governor Mark Carney to retain the record-low interest rate throughout 2016 as the central bank struggles to achieve its 2% target for inflation.
Nevertheless, the slowdown in global growth paired with easing outputs may drag on the labor market, and a dismal employment report may drag on the exchange rate as market participants push out bets for a BoE rate-hike.
How To Trade This Event Risk
Bullish GBP Trade: U.K. Job/Wage Growth Beat Market Expectations
- Need green, five-minute candle following the print to consider a long GBP/USD trade.
- If market reaction favors buying sterling, long GBP/USD with two separate position.
- Set stop at the near-by swing low/reasonable distance from entry; look for at least 1:1 risk-to-reward.
- Move stop to entry on remaining position once initial target is hit, set reasonable limit.
Bearish GBP Trade: Jobless Claims, Average Hourly Earnings Disappoint- Need red, five-minute candle to favor a short GBP/USD trade.
- Implement same setup as the bullish British Pound trade, just in reverse.
Potential Price Targets For The ReleaseGBPUSD Daily
Forum on trading, automated trading systems and testing trading strategies
Press review
Sergey Golubev, 2016.04.21 08:16
Trading the News: U.K. Retail Sales (based on the article)
What’s Expected:
Even though BoE warns that the next policy move will be to normalize monetary policy, the Monetary Policy Committee (MPC) may stick to the sidelines ahead of the U.K. Referendum in June, and the central bank may look to carry its accommodative policy stance into 2017 amid the uncertainty surrounding the economic outlook.
However, sticky wage growth paired with hopes for a stronger recovery may boost private-sector consumption, and a rebound in retail spending may put increased pressure on the BoE to normalize policy sooner rather than later as Governor Mark Carney sees a risk of overshooting the 2% inflation-target over the policy horizon.
How To Trade This Event Risk
Bearish GBP Trade: Retail Sales Falls Another 0.3% or Greater
- Need red, five-minute candle following the GDP report to consider a short British Pound trade.
- If market reaction favors bearish sterling trade, short GBP/USD with two separate position.
- Set stop at the near-by swing high/reasonable distance from entry; look for at least 1:1 risk-to-reward.
- Move stop to entry on remaining position once initial target is hit, set reasonable limit.
Bullish GBP Trade: Household Spending Tops Market Forecast- Need green, five-minute candle to favor a long GBP/USD trade.
- Implement same setup as the bearish British Pound trade, just in reverse.
Potential Price Targets For The ReleaseGBPUSD Daily
Forum on trading, automated trading systems and testing trading strategies
Forecast for Q2'16 - levels for EUR/USD
Sergey Golubev, 2016.04.21 10:56
Ahead of ECB Interest Rates: EUR/USD Intra-Day Technical Analysis
H4 price is located between 100 period SMA and 200 period SMA in the ranging market condition waiting for direction: the price is ranging within the following key erversal support/resistance level:
RSI indicator is estimating the bearish reversal trend to be started in the near future.
SUMMARY : ranging
TREND : waiting for directionForum on trading, automated trading systems and testing trading strategies
Press review
Sergey Golubev, 2016.04.21 14:00
EUR/USD Intra-Day Fundamentals: ECB Minimum Bid Rate and 23 pips price movement
2016-04-21 11:45 GMT | [EUR - Minimum Bid Rate]
if actual > forecast (or previous one) = good for currency (for EUR in our case)
[EUR - Minimum Bid Rate] = Interest rate on the main refinancing operations that provide the bulk of liquidity to the banking system.
==========
"At today’s meeting the Governing Council of the ECB decided that the interest rate on the main refinancing operations and the interest rates on the marginal lending facility and the deposit facility will remain unchanged at 0.00%, 0.25% and -0.40% respectively."
==========
EUR/USD M5: 23 pips price movement by ECB Minimum Bid Rate news event :
Forum on trading, automated trading systems and testing trading strategies
Forecast for Q2'16 - levels for USD/CAD
Sergey Golubev, 2016.04.22 08:43
USD/CAD Intra-Day Technical Analysis - Ahead of Canada Retail Sales
H4 price is on bearish market condition located below Ichimoku cloud: the price is ranging within narrow support/resistance levels for the bear market rally to be started or for the primary bearish trend to be continuing. Chinkou Span line is located below the price indicating the ranging bearish condition, and Absolute Strength indicator is estimating the ranging condition as well in the near future.
If H4 price will break 1.2627 support level on close H4 bar so the primary bearish will be continuing.
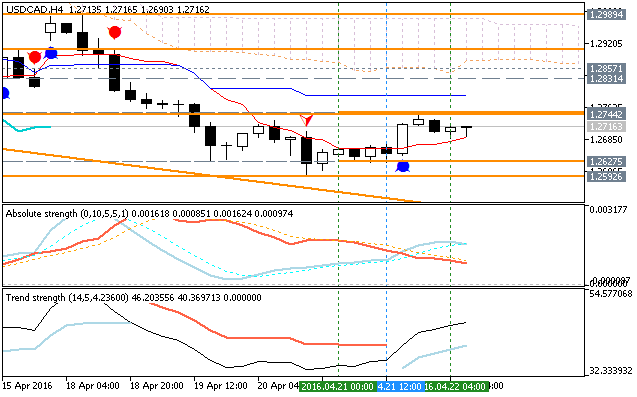
If H4 price will break 1.2744 resistance level so the local uptrend as the bear market rally will be started.
If not so the price will be ranging within the levels.
SUMMARY : bearish
TREND : rangingForum on trading, automated trading systems and testing trading strategies
Forecast for Q2'16 - levels for SILVER (XAG/USD)
Sergey Golubev, 2016.04.22 14:36
SILVER: End Of Week Technicals - Ranging Bullish or Bullish Breakout?
Daily price is on daily bullish breakout with 17.67 resistance level to be broken for the bullish trend to be continuing.
If the price breaks 16.35 support level so the local downtrend as the secondary correction will be started.
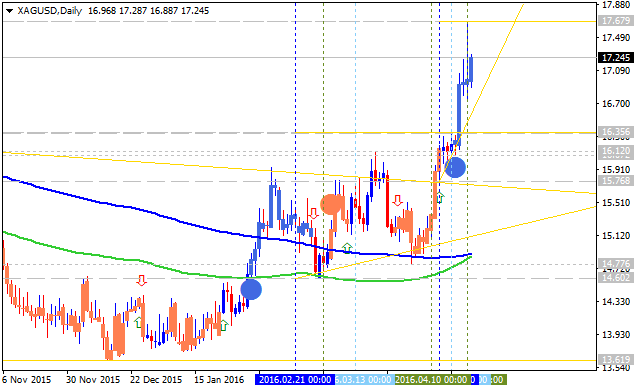
If the price breaks 14.77 support level so the reversal of the price movement from the primary bullish to the primary bearish market condition will be started.
If the price breaks 17.67 resistance level so the bullish trend will be continuing.
If not so the price will be ranging within the levels.
SUMMARY : bullish
TREND : breakoutForum on trading, automated trading systems and testing trading strategies
Press review
Sergey Golubev, 2016.04.22 17:42
EUR/USD Intra-Day Fundamentals: Markit U.S. Manufacturing PMI and 24 pips price movement
2016-04-22 13:45 GMT | [USD - Manufacturing PMI]
if actual > forecast (or previous one) = good for currency (for USD in our case)
[USD - Manufacturing PMI] = Level of a diffusion index based on surveyed purchasing managers in the manufacturing industry.
==========
"At 50.8 in April, down from 51.5 in March, the seasonally adjusted Markit Flash U.S. Manufacturing Purchasing Managers’ Index™ (PMI™) signalled the weakest upturnin overall business conditions since September 2009. The flash PMI index, which is based on approximately 85% of usual monthly survey replies, was only marginally above the crucial 50.0 no-change threshold."
==========
EUR/USD M5: 24 pips price movement by Markit U.S. Manufacturing PMI news event :