Forecast for Q2'16 - levels for Brent Crude Oil
Crude Oil Intra-Day Technical Analysis - breakdown with the bearish reversal
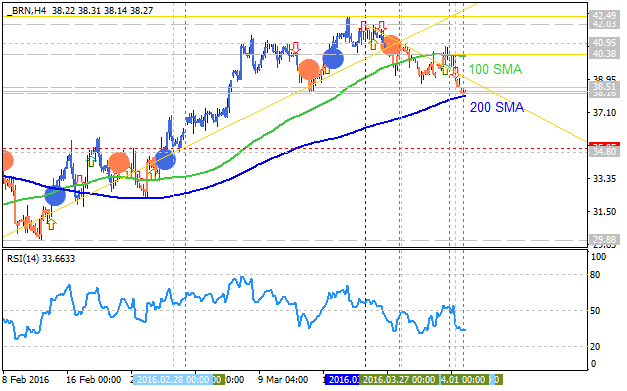
H4 price
is crossing 200 period SMA for the reversal of intra-day price movement from the secondary correction within the bullish trend to the primary bearish market condition: the price is breaking 38.16 support level to below for the breakdown to be continuing. The key reversal support/resistance levels are the following:
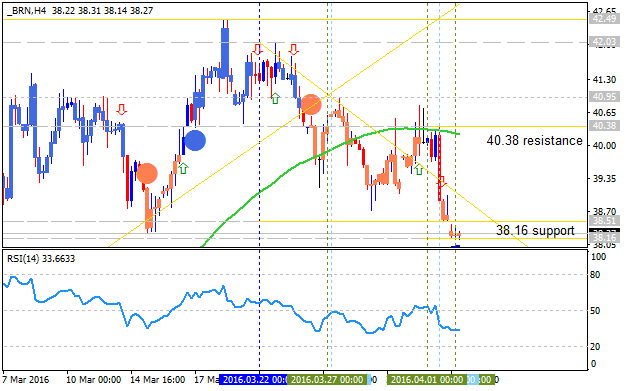
- 38.16 support level located in the beginning of the bearish area of intra-day chart, and
- 40.38 resistance level located on the border between the ranging bullish and the primary bullish area.
RSI indicator is estimating the bearish breakdown to be continuing.
- If the price will break 40.38 resistance level so the primary bullish trend will be continuing.
- If price will break 38.16 support so the bearish reversal will be started up to 35.05 level as the next bearish target to re-enter.
- If not so the price will be ranging within the levels.
| Resistance | Support |
|---|---|
| 40.38 | 38.16 |
| 42.49 | 35.05 |
- Recommendation to go short: watch the price to break 38.16 support level for possible sell trade
- Recommendation to go long: watch the price to break 40.38 resistance level for possible buy trade
- Trading Summary: breakdown
SUMMARY : ranging
Ahead of U.S. commercial crude oil inventories news event: Crude Oil Intra-Day Price Action Analysis - ranging bullish with the correction to be started
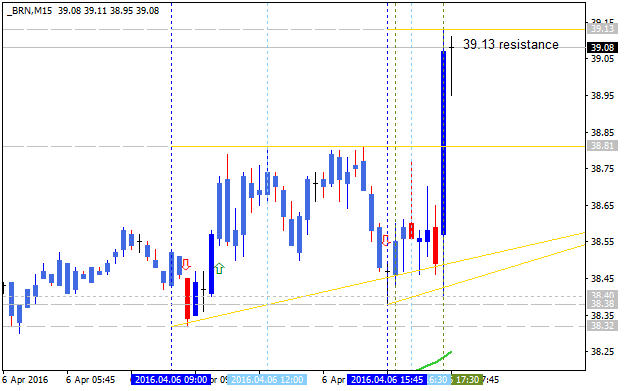
M15 price is located to be above 100 period SMA (100 SMA) and 200 period SMA (200 SMA) for the primary bearish market condition. The price is started with the secondary ranging by breaking 50.0% Fibo support level at 38.55 to below with yesterday High Line at 38.37 as the next possible target to re-enter. The price is testing the Weekly low Line at 38.51 to below for the secondary correction to be continuing.
The price is located within the following key s/r reversal levels:
- 38.79 resistance level located far above 100SMA/200 SMA in the primary bullish area of the chart, and
- Daily Pivot at 37.99 located near 200 SMA on the border between the primary bearish and the primary bullish area.
RSI indicator is estimating the ranging bullish condition to be continuing.

If the price will break 37.99
support level so the reversal of intra-day price movement from the primary bullish to the primary bearish market condition will be started.
If the price will break 38.79 from below to above so the primary bullish trend will be continuing.
If not so the price will be ranging within the levels.
Trend:
Ahead of U.S. commercial crude oil inventories news event: Crude Oil Intra-Day Price Action Analysis - ranging bullish with the correction to be started
If the price will break 37.99
support level so the reversal of intra-day price movement from the primary bullish to the primary bearish market condition will be started.
If the price will break 38.79 from below to above so the primary bullish trend will be continuing.
If not so the price will be ranging within the levels.
Trend:
Commercial Crude Oil Invertories decreased by 4.9M barrels from the previous week against the 3.1M forecasts, and the intra-day price for Crude Oil was rised: the 38.79 resistance level was broken to above with good bullish breakdown. The price is testing 30.13 resistance level for the bullish breakout to be continuing.

By the way, on the daily chart - the price is still on the ranging bullish market condition located below 200-day SMA (200 SMA) and within 100 SMA/200 SMA ranging area of the chart. The key reversal s/r levels for the daily price are the following:
- 42.49 resistance level located near 200-day SMA on the border between the bearish and bullish area of the chart, and
- 37.23 support level located below 200 SMA and near 100 SMA on the border between the ranging bearish and the primary bearish area.
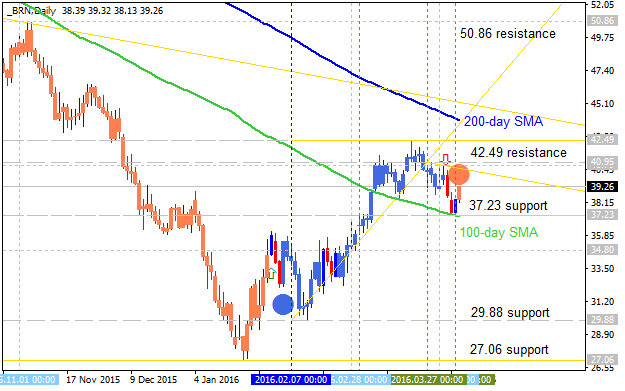
If daily price breaks 42.49 resistance level to above so the bullish reversal will be started with 50.86 bullish target to re-enter.
If daily price breaks 37.23 support level to below so the primary bearish trend will be continuing withiut secondary ranging with 29.88/27.06 bearish real targets.
The medium term forecast for Crude Oil is the following: I think the price will be on the primary bearish market condition for the ranging within 42.49 resistance level and 29.88 support level with the possibility to test 27.06 support by year-end.
Forum on trading, automated trading systems and testing trading strategies
Sergey Golubev, 2016.04.09 14:36
Week Ahead: Economic Data, Financial Sector Earnings, Wells Fargo, Crude Oil (based on the article)
- "One key data marker is March retail sales early Wednesday. So far this year, this benchmark has delivered mixed results, but traditional brick and mortar stocks have done well. In February, retail sales fell 0.1%."
- "There’s also the Producer Price Index on Wednesday morning, and the Consumer Price Index on Thursday. Both PPI and CPI fell in February, but core CPI, which excludes volatile food and energy components, rose in both January and February, and was up 2.3% year over year through February, the largest year-over-year gain in nearly four years."
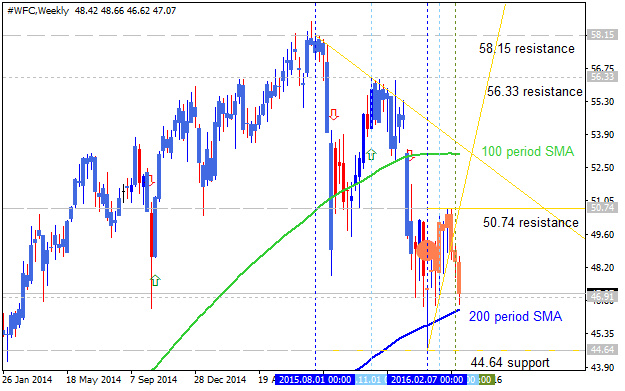
"On the earnings front, the focus is likely to be on the big financial stocks, with JP Morgan Chase reporting before the open on Wednesday; Wells Fargo WFC reporting before the open on Thursday, and Citigroup reporting before the open Friday."
"Oil Up? Stocks Rise Too. After searching for a catalyst earlier last week, the stock market seemed to find one on Friday: Oil. The stock market has been correlated closely with oil most of this year, and some of the strength we saw in equities Friday came in part from rising oil prices. Energy stocks were among the leaders, up more than 1.8% by midday Friday. Oil again could be a big factor in the coming week, and it will be interesting to see what the government says about U.S. stockpiles in its weekly supply report Wednesday as the U.S. heads into the spring and summer driving season. There’s also the planned April 17 supplier meeting, when we’ll find out if key OPEC and non-OPEC suppliers can agree on a production freeze."
Crude Oil Technical Analysis 2016, 10.04 - 17.04: bullish daily breakout with 43 resistance as the bullish target to re-enter
Daily price is on bullish breakout to be located above Ichimoku cloud and Senkou Span line which is the virtual border between the primary bearish and the primary bullish trend on the chart. The price is breaking 43.00 resistance level to above for the bullish trend to be continuing. The bearish reversal level at 37.23 is located to be inside Ichimoku cloud, but, anyway - Absolute Strength indicator is estimating the bullish trend to be continuing in the near future so the bearish daily reversal is very unlikely in this situation for example.
If D1 price will break 37.23
support level on close bar so the reversal of the price movement from the primary bullish to the ranging bearish market condition will be started with 31.78 level to re-enter.
If D1 price will break 43.00
resistance level on close bar from below to above so the bullish trend will be continuing.
If not so the price will be on ranging within the levels.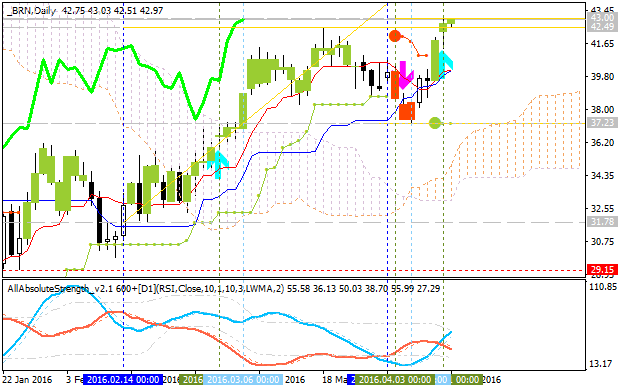
- Recommendation for long: watch close D1 price to break 43.00 for possible buy trade
- Recommendation
to go short: watch D1 price to break 37.23 support level for possible sell trade
- Trading Summary: daily bullish breakout
| Resistance | Support |
|---|---|
| 43.00 | 37.23 |
| N/A | 31.78 |
SUMMARY : daily bullish breakout
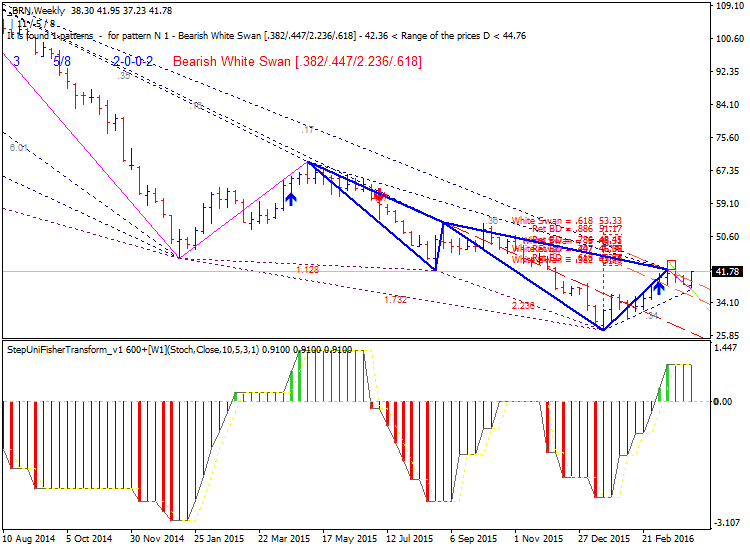
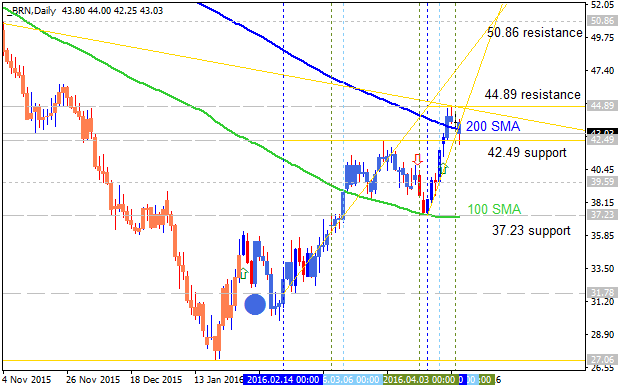
TREND : bullishCrude Oil Medium-Term Technical Analysis: ranging near 200 SMA waiting for fundamental news for direction
The price is located near 200-day SMA (200 SMA) and below 100-day SMA (100 SMA) on the
border between the primary bullish and the ranging bearish trend on the
chart within the following narrow support/resistance levels:
- 44.89 resistance level located near and above 200 SMA on the beginning of the bullish area of the chart, and
- 42.49 support level located below 200 SMA and above 100 SMA in the beginning of the ranging bearish area.
RSI indicator is estimating the secondary ranging market condition.
- If the price will break 44.89
resistance level so the bullish trend will be started.
- If price will break 42.49 support so the ranging bearish condition will be continuing.
- if not so the price will be ranging within the levels.
| Resistance | Support |
|---|---|
| 44.89 | 42.49 |
| 50.86 | 39.59 |
| N/A | 37.23 |
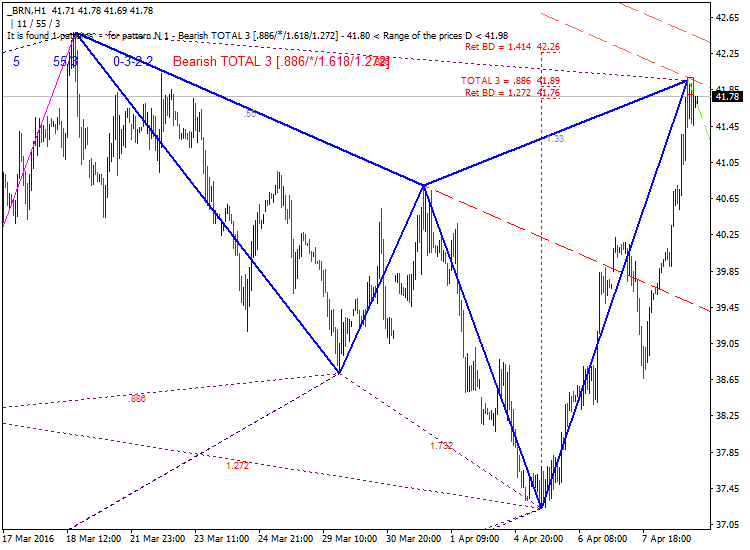
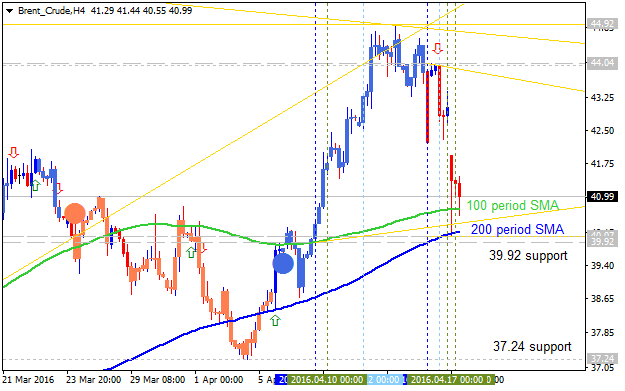
Crude Oil Intra-Day Technical Analysis - breakdown with intra-day bearish reversal
H4 price is on the secondary correction which was started today morning because of Doha talks fail: the price broke key support level to be stopped near 100 SMA/200 SMA reversal area and near above 39.92 support bearish reversal level. If this 39.92 level will be broken by the price to below on close bar so the intra-day bearish reversal will be started, otherwise - ranging bullish.
- If price will break 39.92 support so the intra-day bearish reversal will be started with 37.24 target as the next level to re-enter.
- If not so the price will be ranging within the levels.
| Resistance | Support |
|---|---|
| 44.01 | 39.92 |
| 44.92 | 37.24 |
- Recommendation to go short: watch the price to break 39.92 support level for possible sell trade
- Recommendation to go long: n/a
- Trading Summary: breakdown
SUMMARY : correction
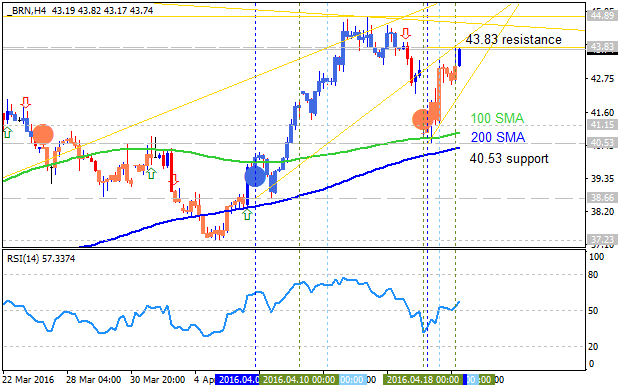
Crude Oil Intra-Day Technical Analysis - bullish trend to be continuing in case of 43.83 resistance to be broken
H4 price is on bullish ranging condition within the following key support/resistance levels:
- 43.83 resistance level located above 100 SMA/200 SMA in the bullish area of the chart, and
- 40.53 support level located within 100 SMA/200 SMA reversal area on the border between the primary bearish and the primary bullish trend.
RSI indicator is estimating the bullish trend to be continuing in the near future.
- If the price will break 43.83
resistance level so the bullish trend will be continuing.
- If price will break 40.53 support so the reversal of the price movement from the primary bullish to the primary bearish market condition will be started.
- If not so the price will be ranging within the levels.
| Resistance | Support |
|---|---|
| 43.83 | 40.53 |
| 44.89 | 38.66 |
- Recommendation to go short: watch the price to break 40.53 support level for possible sell trade
- Recommendation to go long: watch the price to break 43.83 support level for possible sell trade
- Trading Summary: bullish
SUMMARY : bullish
Forum on trading, automated trading systems and testing trading strategies
Sergey Golubev, 2016.04.20 16:55
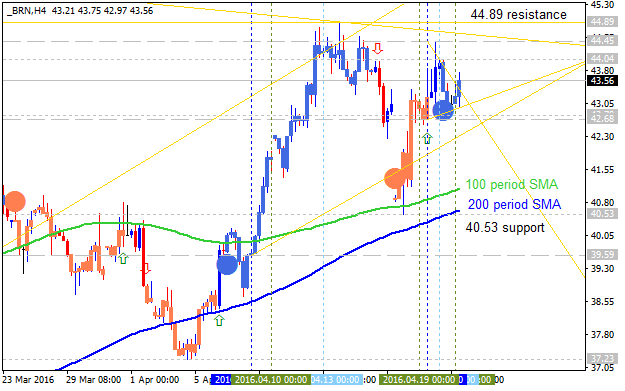
U.S. commercial crude oil inventories news event: Crude Oil Intra-Day Price Action Analysis - intra-day bullish trend to be continuing in the future with 44.89 level as a target
2016-04-20 14:30 GMT | [USD - Crude Oil Inventories]
- past data is 6.6M
- forecast data is 2.2M
- actual data is 2.1M according to the latest press release
[USD - Crude Oil Inventories] = Change in the number of barrels of crude oil held in inventory by commercial firms during the past week.
==========
"U.S.
commercial crude oil inventories (excluding those in the Strategic
Petroleum Reserve) increased by 2.1 million barrels from the previous
week. At 538.6 million barrels, U.S. crude oil inventories are at
historically high levels for this time of year. Total motor gasoline
inventories decreased by 0.1 million barrels last week, but are well
above the upper limit of the average range. Finished gasoline
inventories increased whileblending components inventories decreased
last week. Distillate fuel inventories decreased by 3.6 million barrels
last week but are well above the upper limit of the average range for
this time of year. Propane/propylene inventories rose 1.2 million
barrels last week and are above the upper limit of the average range.
Total commercial petroleum inventories decreased by 0.4 million barrels
last week."
==========
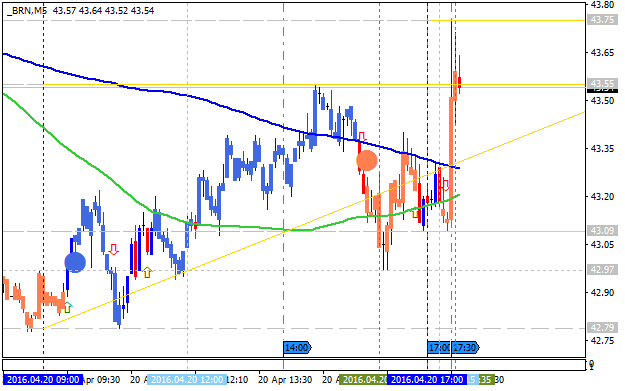
Crude Oil M5: breakout with bullish reversal.
The price broke 200 SMA/100 SMA reversal area to above on the recent
commercial crude oil inventories news event for now: price was
reversed to the primary bullish market condition with 43.75 resistance
level for the bullish trend to be continuing, otherwise - ranging.
==========
Crude Oil H4: ranging bullish. The price is on bullish ranging condition within the following key support/resistance levels:
- 44.89 resistance level located far above 100 SMA/200 SMA in the bullish area of the chart, and
- 40.53
support level located within near 200 SMA reversal area on the
border between the primary bearish and the primary bullish trend.
RSI indicator is estimating the ranging bullish trend to be continuing in the near future.
- If the price will break 44.89
resistance level so the bullish trend will be continuing.
- If price will break 40.53 support so the reversal of the price movement from the primary bullish to the primary bearish market condition will be started.
- If not so the price will be ranging within the levels.
| Resistance | Support |
|---|---|
| 44.04 | 40.53 |
| 44.89 | 39.59 |
- Recommendation to go short: watch the price to break 40.53 support level for possible sell trade
- Recommendation to go long: watch the price to break 44.89 support level for possible sell trade
- Trading Summary: bullish
SUMMARY : bullish
- Free trading apps
- Over 8,000 signals for copying
- Economic news for exploring financial markets
You agree to website policy and terms of use
Forum on trading, automated trading systems and testing trading strategies
Press review
Sergey Golubev, 2016.04.01 09:07
Ahead of NFP: Fundamental Forecasts by Bank of America Merrill Lynch, Nordea Bank AB and Skandinaviska Enskilda Banken (adapted from the article)
2016-04-01 08:55 GMT | [USD - Non-Farm Employment Change]
if actual > forecast (or previous one) = good for currency (for USD in our case)
[USD - Non-Farm Employment Change] = Change in the number of employed people during the previous month, excluding the farming industry.
==========
==========
Crude Oil M5: intra-day ranging within narrow s/r levels waiting for direction. Intra-day price is located to be within 100 period SMA and 200 period SMA for the total ranging market condition within narrow s/r levels waiting for direction. If the price breaks 40.19 resistance on close candle so the reversal of the intra-day price movement from the ranging bearish to the primary bullish trend will be started with 40.27 target to re-enter. And if the price breaks 39.95 support level to below so the primary intra-day bearish trend will be continuing with 39.69 as the nearest target.