Elite indicators :) - page 1501
You are missing trading opportunities:
- Free trading apps
- Over 8,000 signals for copying
- Economic news for exploring financial markets
Registration
Log in
You agree to website policy and terms of use
If you do not have an account, please register
Is it possible to fixed this problem?
Is it possible to fixed this problem?
hi
Someone with technology
this indicator Add alert&mail please
Forum on trading, automated trading systems and testing trading strategies
Please edit your post to insert your image (don't attach an image, insert the image)
Thank you.
dear sir, mladen
can u make this indicator - end point
hi guys, I'm using mt5 and in my EA (that is a "trend EA" ) what indicator I can use to "easy" detect sideway market?
Almost any indicator can be used to estimate the secondary trend for example -
Forum on trading, automated trading systems and testing trading strategies
Market Condition Evaluation based on standard indicators in Metatrader 5
Sergey Golubev, 2013.01.02 15:33
Just back to this post with 3 Stoch MaFibo system/setup.
1. Trend following
1.1. Primary trend
Uptrend (bullish):
Downtrend (bearish):
Forum on trading, automated trading systems and testing trading strategies
Market Condition Evaluation based on standard indicators in Metatrader 5
Sergey Golubev, 2013.01.02 15:58
So, concerning trend following way -
uptrend if
- signal line (dotted line) is below main line
&&
- both lines are growing
&&
- both lines are above level 50
&& is and in mql5 programming language (read more here) :)
============
downtrend:
- signal line (dotted line) is above main line
&&
- both lines are falling
&&
- both lines are below level 50
============
Why level 50? No idea. It may be any level but 50 is usually used for that.
Example - if you ask the coder to program EA for you telling him that "the signal is filtering by stochastics indicator" so the coder will use trend following way of fintering with the level 50.
Forum on trading, automated trading systems and testing trading strategies
Market Condition Evaluation based on standard indicators in Metatrader 5
Sergey Golubev, 2013.01.02 16:10
1.2. Secondary trend.
Some people may ask:
"that is fine but what ... if signal line (dotted line) is above main line and both lines are fall but both lines are above level 50?"
Good question.
It is secondary trend.
There are many kinds of secondary trend but we will discuss Correction and Bear Market Rally.
This is Correction:
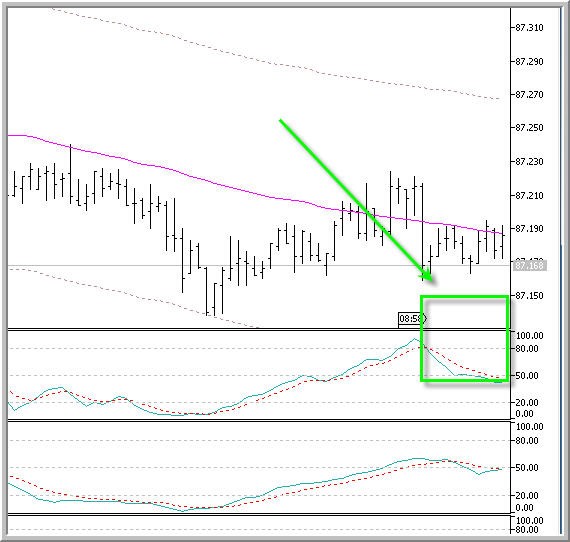
Correction is the following: it is still uptrend (all lines are above 50) but all the lines are moved on downtrend way. We will have downtrend when those lines will cross level 50 from above.
This is correction.
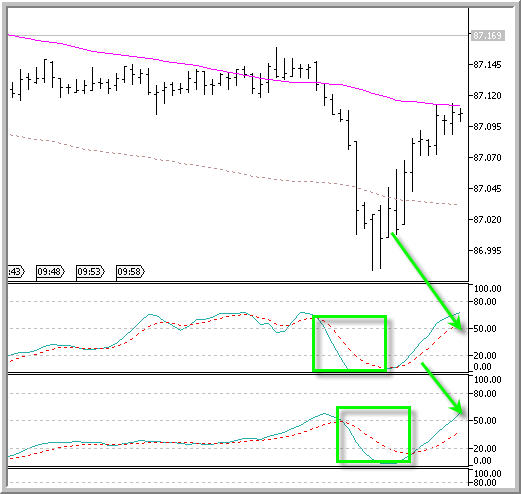
And this is Bear Market Rally:
Forum on trading, automated trading systems and testing trading strategies
Market Condition Evaluation based on standard indicators in Metatrader 5
Sergey Golubev, 2013.01.02 16:31
People are calling Correction and Bear Market Rally using just one word for both: correction.
Programmers are having different name for it: counter trend.
So, if someone is telling: "I have counter trend EA based on stochastic indicator" - we know what he is talking about.
There are some more kinds of secondary trend: non-trading, ranging and more.
But we will discuss it when we will make some explanation about divergence.
By the way, what is the most great indicator to estimate primary and secondary trend?
This is standard indicator in MT5:
MACD
============
Some people suggested to me to write some article about. But I am not ready yet. Besides, what I am explaining here is my practical knowlegde.
may be, later - I will write something.
More to follow.
the other example -
Forum on trading, automated trading systems and testing trading strategies
Gold is Reaching at 1270
Sergey Golubev, 2013.07.01 21:04
How can we know: correction, or bullish etc (in case of using indicator for example)?
well ... let's take AbsoluteStrength indicator from MT5 CodeBase.
bullish (Bull market) :
bearish (Bear market) :
ranging (choppy market - means: buy and sell on the same time) :
flat (sideways market - means: no buy and no sell) :
correction :
correction in a bear market (Bear Market Rally) :
Forum on trading, automated trading systems and testing trading strategies
Gold is Reaching at 1270
Sergey Golubev, 2013.07.01 21:43
red lines are for sell (sell lines), blue lines are for buy (buy lines). So, bullish (uptrend) and bearish (downtrend) are separated by color of the lines in this indicator. Buy is main blue line is above blue signal line and both are in uptrend. If "sell within no buy" - this is correction (opposite for rally). if "no buy" and "no sell" - this is flat.And this is whole the story about -
---------------------
Market condition
Forum on trading, automated trading systems and testing trading strategies
Trade/Range Identification
Sergey Golubev, 2018.01.06 09:19
And in case of MT4 -
============
Market Condition
The beginning:
After
============
Good one.
It doesnot repaint.