NZDUSD Technical Analysis 17.11 - 01.12 : Ranging Before Breakout
Just to remind :
newdigital, 2013.07.01 21:04
How can we know: correction, or bullish etc (in case of using indicator for example)?
well ... let's take AbsoluteStrength indicator from MT5 CodeBase.
bullish (Bull market) :
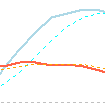
bearish (Bear market) :
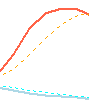
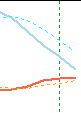
ranging (choppy market - means: buy and sell on the same time) :
flat (sideways market - means: no buy and no sell) :
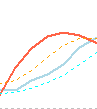
correction :
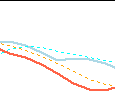
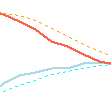
correction in a bear market (Bear Market Rally) :
MetaTrader Trading Platform Screenshots
MetaQuotes Software Corp., MetaTrader 5, Demo
NZDUSD W1 : formed Retrecement pattern for uptrend

MetaTrader Trading Platform Screenshots
MetaQuotes Software Corp., MetaTrader 5, Demo
NZDUSD W1 : forming Retrecement patternd for bearish

This is the situation NZDUSD for now :
H1 - flat :
MetaTrader Trading Platform Screenshots
MetaQuotes Software Corp., MetaTrader 5, Demo
NZDUSD H1 - flat

H4 - flat :
MetaTrader Trading Platform Screenshots
MetaQuotes Software Corp., MetaTrader 5, Demo
NZDUSD H4 - flat

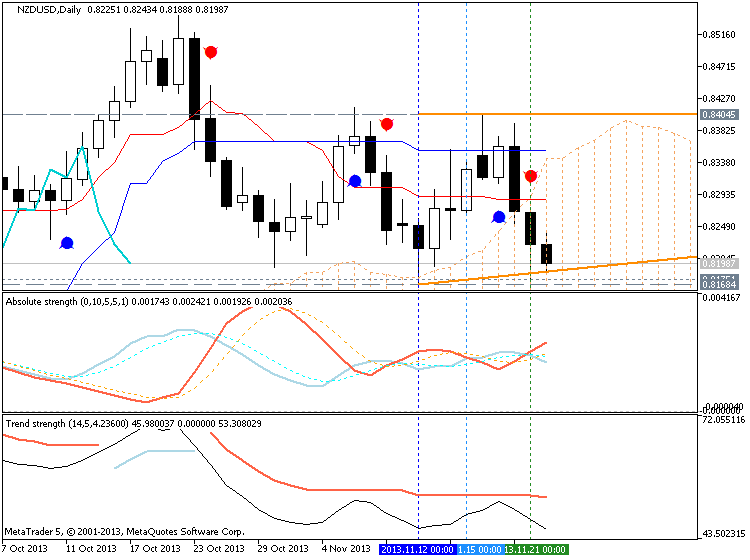
D1 - bullish started : price is trying to break 0.8356 resistance with 0.8414 as the next one
MetaTrader Trading Platform Screenshots
MetaQuotes Software Corp., MetaTrader 5, Demo
NZDUSD D1 - bullish started : price is trying to break 0.8356 resistance with 0.8414 as the next one

W1 - breakout started on close bar ... by the way - flat
MetaTrader Trading Platform Screenshots
MetaQuotes Software Corp., MetaTrader 5, Demo
NZDUSD W1 - breakout started on close bar ... byt the way - flat

newdigital, 2013.11.18 17:10
2013-11-18 15:00 GMT (or 16:00 MQ MT5 time) | [USD - NAHB Housing Market Index]
- past data is 54
- forecast data is 56
- actual data is 54 according to the latest press release
if actual > forecast = good for currency (for USD in our case)
==========
U.S. Homebuilder Confidence Holds Steady In November
Homebuilder confidence in the U.S. held steady in the month of November, according to a report released by the National Association of Home Builders on Monday.
The report said the NAHB/Wells Fargo Housing Market Index came in at 54 in November, unchanged from the downwardly revised reading for October.
Economists had expected the index to come in unchanged compared to the 55 originally reported for the previous month.
The NAHB noted that the reading above 50 indicates that more builders viewed market conditions as good than poor for the sixth consecutive month.
NAHB Chief Economist David Crowe said, "The fact that builder confidence remains above 50 is an encouraging sign, considering the unresolved debt and federal budget issues cause builders and consumers to remain on the sideline."
MetaTrader Trading Platform Screenshots
MetaQuotes Software Corp., MetaTrader 5, Demo
NZDUSD M5 : 24 pips price movement by USD - NAHB Housing Market Index

Indicators and template to make the image (see post above) was taken from Asctrend System - read here :
newdigital, 2013.05.12 16:25
This is the thread about Brainwashing system. We will start with original version of this system and will improve it later.
==========
Just something about the history. There are 3 famous signals system (manual trading systems based on signal indicators): Asctrend, BrainTrend and Brainwashing. First two system were already explained and developed by indicators and EAs. So, we are going to discuss the last signal system: Brainwashing.
==========
Just for information:
ASCTREND SYSTEM
The Theory.
- asctrend system vs braintrading system: pros and cons
- Asctrend indicator in MT5 Codebase
- trading on open bar' and 'trading on close bar' concept
- Re-enter: practical example about how to trade asctrend manually with re-enter options.
- basic trading rules for asctrend system
- detailed rules for asctrend: practical illustration of asctrend concept
- Nick Rypock Trailing Reverse indicator as a standard filter for asctrend: the theory.
Manual Trading statements
- first metatrader statement for this system using just one asctrend indicator only.
- Next MT5 statement with this system (manual trading).
- Trading's continuing - one more MT5 statement.
- Next updating MT5 statement.
Second version of this manual trading system and for now - asctrend indicator together with NRTR indicator
First version of AsctrendND EA.
- optimization results for M15 timeframe for EURUSD, GBPUSD, USDCHF and USDJPY;
- backtesting results and settings for EURUSD M15 timeframe;
- optimization results for this EA for EURUSD H4 using Balance + max Sharpe ration;
- backtesting results with the settings 'Balance + Sharpe ratio', EURUSD H4;
- optimization results of this EA with EURUSD M15 timeframe;
- backtesting and the settings for EURUSD M15 with max Sharpe ratio;
- this is the other settings which may be some preliminary settings for martingale version;
- the other optimization results for GBPUSD M15
Next version of AsctrendND EA (verion 1.02) with TrendStrength filter added.
- optimization results for EURUSD M15 (for 1 year), every tick, slow complete ..., for Balance max;
- results for backtesting and the settings for EURUSD M15 timeframe, for one year with 2 indicators as the filters: NRTR Color Line and TrendStrength;
- optimization results for GBPUSD M15 for 1 year - the results and set file are attached;
- backtesting results and the settings for GBPUSD M15;
- optimization results for one year for EURUSD H1 timeframe with Balance + max Sharpe ratio;
- backtesting results with the settings for this EURUSD H1 with Balance + max Sharpe;
BRAINTRADING SYSTEM
- BrainTrending indicators to download with template.
- Rules to trade manually
- How to install
How To Create Your Own Mmanual Trading Signal System Based On Indicators From MT5 CodeBase - Instruction For Non-Programmers
- more to follow
This is interesting situation - Chinkou Span line is going through the price :
So,
- W1 timeframe - flat
- D1 - ranging
- H4 - flat
- H1 - ranging
- www.mql5.com
It was breakdown for H4 :
MetaTrader Trading Platform Screenshots
MetaQuotes Software Corp., MetaTrader 5, Demo
NZDUSD H4 - breakdown

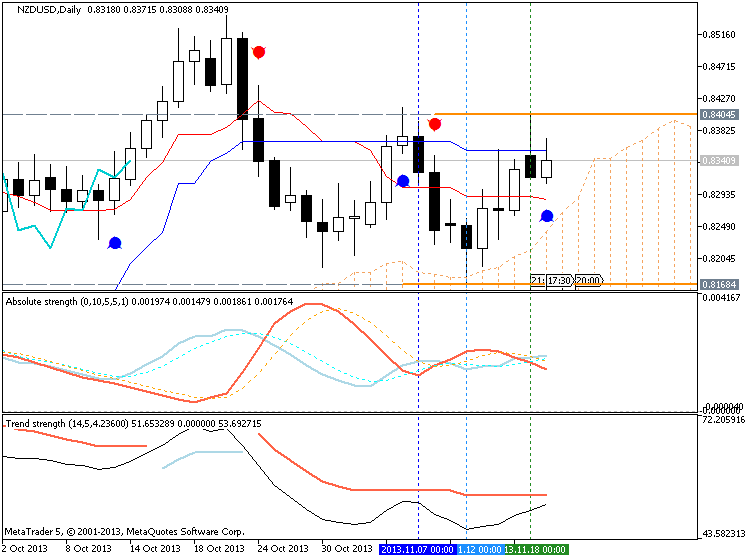
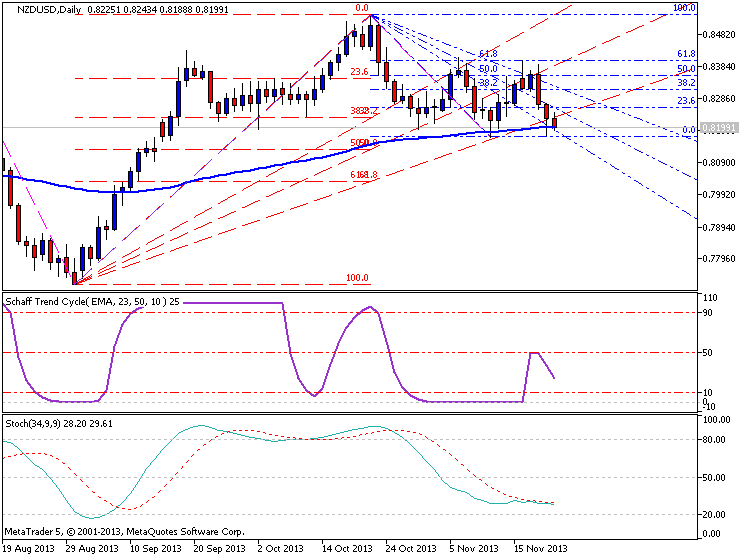
but as we see from D1 timeframe - price did not break 0.8231 support level, and the price is located inside Ichimoku cloud for this daily bar, and it is below Sinkou Span A line. So this downtrend movement can be considered as Ranging Bearish :
MetaTrader Trading Platform Screenshots
MetaQuotes Software Corp., MetaTrader 5, Demo
NZDUSD D1 - ranging

It means - the situation can be turned from Ranging Bearish to Ranging Bullish any time.
newdigital, 2013.11.22 06:29
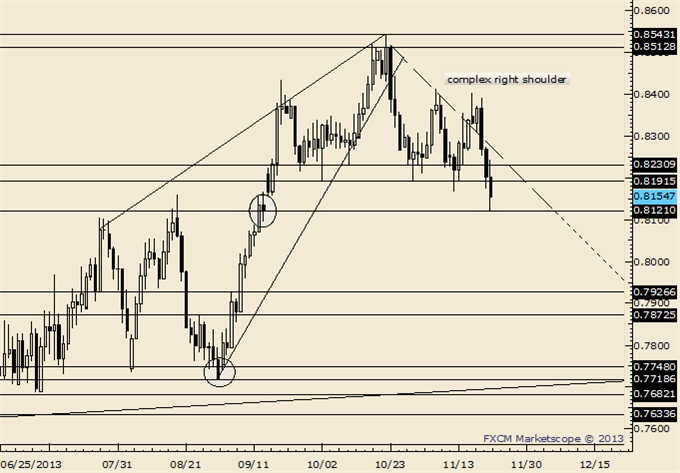
NZD/USD 4th Attempt to Separate from .8200
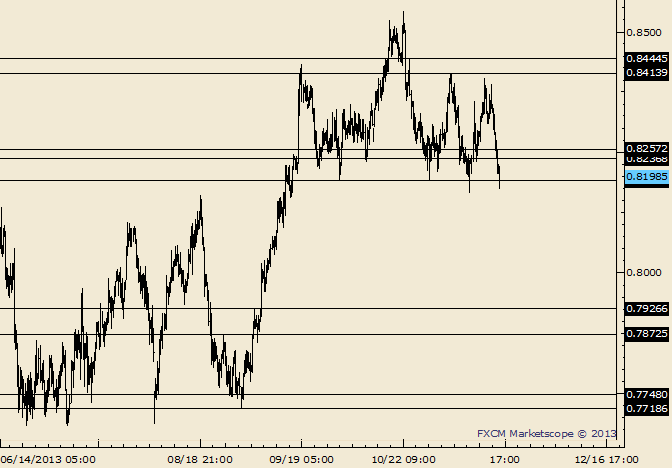
- The NZDUSD remains one of the more compelling longer term bearish possibilities. Consider that…
- The decline from the April high unfolded in 5 waves (impulsive), the advance from the August low is defined by converging lines (pennant, common in bear market advances)
- Action since 9/18 may compose a head and shoulders top.
Trading Strategy: This is the fourth attempt to separate from .8200. It’s unlikely that the market holds this time. A short position is likely after some consolidation (and when the opportunity is offered to add to the AUDUSD position).
LEVELS: .8075 .8133 .8168 | .8225 .8257 .8276
NZDUSD (based on AUD/USD and NZD/USD Breakdown; Here are Trading Tactics article)
- The NZDUSD remains one of the more compelling longer term bearish possibilities. Consider that…
- The decline from the April high unfolded in 5 waves (impulsive), the advance from the August low is defined by converging lines (pennant, common in bear market advances)
- A head and shoulders top was confirmed this week. Resistance is estimated from .8190 to .8230.
Trading Strategy: Looking to short early next week…probably above .8200 and as high as .8265.

- www.dailyfx.com
- Free trading apps
- Over 8,000 signals for copying
- Economic news for exploring financial markets
You agree to website policy and terms of use
Chinkou Span line of Ichimoku indicator crossed historical price on close D1 bar for good breakout - it means that bullish trend will be continuing for NZDUSD after few ranging days. Besides. This Chinkou Span line is crossing the price on open bar for W1 timeframe indicating same bullish continuiong in the near future.
But W1 price is located inside Ichimoku cloud/kumo, and D1 price is having 2 strong resistance levels on the way to upward, H4 timeframe is indicating the flat, and secondary correction is started on H1 timeframe for this pair.
Thus, I am expecting for ranging market to be continuing at least in the beginning of the next week with the high possibility to bullish breakout on the future.
If the price will cross 0.8414 so the primary bullish will be continuing. If the price will cross 0.8542 resistance level from below to above so we may get long term uptrend for NZDUSD for W1 and D1 timeframe.
If the price will break 0.8231 support level from above to above so we will see ranging bearish market condition (primary bearish with secondary ranging trend)
Everything between those above mentioned levels can be considered as ranging bullish.
UPCOMING EVENTS (high/medium impacted news events which may be affected on NZDUSD price movement for this coming week)
2013-11-20 13:30 GMT (or 14:30 MQ MT5 time) | [USD - CPI]
2013-11-21 01:45 GMT (or 02:45 MQ MT5 time) | [CNY - HSBC Flash Manufacturing PMI]
2013-11-21 02:00 GMT (or 03:00 MQ MT5 time) | [NZD - Credit Card Spending]
2013-11-21 21:45 GMT (or 22:45 MQ MT5 time) | [NZD - Visitor Arrivals]
2013-11-26 21:45 GMT (or 22:45 MQ MT5 time) | [NZD - Trade Balance]
2013-11-28 00:00 GMT (or 01:00 MQ MT5 time) | [NZD - Business Confidence]
2013-11-28 21:45 GMT (or 22:45 MQ MT5 time) | [NZD - Building Consents]
Please note : some US (and CNY) high/medium impacted news events (incl speeches) are also affected on NZDUSD price movement
SUMMARY : ranging
TREND : bullish
Intraday Chart