Weekly EUR/USD Outlook: 2017, February 19 - February 26(based on the article)
EUR/USD was looking for a new direction as politics continued moving markets. The upcoming week features PMIs and some business surveys.
German PPI: Monday, 7:00. A rise of 0.3% is on the cards now.
Bundesbank monthly report: Monday, 11:00.
Consumer Confidence: Monday, 15:00.
PMIs: Tuesday morning: 8:00 for France, 8:30 for Germany and 9:00 for the whole euro-area, showing the preliminary assessment for February.
German Ifo Business Climate: Wednesday, 21:00. Germany’s No. 1 Think Tank surprised last month with a lower assessment of German business confidence in January.
CPI (final): Wednesday, 10:00.
LTRO: Wednesday, 10:30.
Belgian NBB Business Climate: Wednesday, 14:00.
German GDP (final): Thursday, 7:00.
GfK German Consumer Climate: Thursday, 7:00. A score of 10.3 is estimated now.
EUR/USD was looking for a new direction as politics continued moving markets. The upcoming week features PMIs and some business surveys. Here is an outlook for the highlights of this week and an updated technical analysis for EUR/USD. German GDP came out below expectations, dragging the overall GDP figures lowers. However, the European...
EURUSD technical Outlook - bearish ranging within Fibo levels (based on the article)
Daily price is located below 100 SMA/200 SMA in the bearish area of the chart for the ranging between Fibo
support level at 1.0521 and Fibo resistance level at 1.0828. If the price breaks 1.0521 support so the primary bearish trend will be resumed, if the price breaks 1.0828 resistance so the secondary rally will be started, otherwise - ranging.
"A sharp Euro recovery stalled at a familiar chart barrier below the 1.07
figure, hinting that a corrective bounce from a monthly low may have
been exhausted. Near-term positioning has favored the downside since
prices broke through the floor of a bearish Rising Wedge chart pattern
two weeks ago."
"Near-term support is in the 1.0518-28 area (November 24 low, 23.6%
Fibonacci expansion), with a daily close below that exposing the
1.0341-67 zone (December 15 low, 38.2% level). Alternatively, a push
above support-turned-resistance at 1.0682 opens the door for a retest of
the 38.2% Fib retracement at 1.0828."
sharp Euro recovery stalled at a familiar chart barrier below the 1.07 figure, hinting that a corrective bounce from a monthly low may have been exhausted. Near-term positioning has favored the downside since prices broke through the floor of a bearish Rising Wedge chart pattern two weeks ago. Near-term support is in the 1.0518-28 area...
if actual > forecast (or previous one) = good for currency (for CAD in our case)
[CAD - Wholesale Sales] = Change in the total value of sales at the wholesale level.
==========
From official report:
"Wholesale sales rose 0.7% to $57.3 billion in December, a third
consecutive gain. Six of the seven subsectors, representing 82% of total
wholesale sales, reported increases. The machinery, equipment and
supplies subsector and the building material and supplies subsector
contributed the most to the advance."
"In volume terms, wholesale sales were up 0.9%."
==========
USD/CAD M5: range price movement by Canada's Wholesale Trade news event
[AUD - Monetary Policy Meeting Minutes] = Detailed record of the RBA Reserve Bank Board's most recent meeting, providing in-depth insights into the economic conditions that influenced their decision on where to set interest rates.
"As expected, the minutes of the February monetary policy meeting of the Board of the Reserve Bank provided little additional insight to the Governor’s post-meeting statement and the February Statement on Monetary Policy."
"We see nothing in these minutes to change our view that the official cash rate will remain on hold throughout 2017 and 2018. Markets continue to anticipate rate hikes in 2018 while a considerable number of commentators are predicting rate cuts in 2017. The middle course seems a much more likely outcome particularly given our view that growth momentum can pick up in 2017 but slow markedly through 2018 posing risks for the labour market and economic activity."
==========
AUD/USD M5: 21 pips range price movement by RBA Monetary Policy Meeting Minutes news event
Minutes of the monetary policy meetings of the Reserve Bank Board are published two weeks after each meeting, and explain the monetary policy decision. The Reserve Bank Board normally meets eleven times each year, on the first Tuesday of each month, except January.
Nvidia - one of the strongest performing stocks in 2016(based on the article)
Shares price is located in the bullish area of the daily chart above Ichimoku cloud: the price is continuing with the secondary correction by breaking descending triangle pattern together with 105.65 support level to below for the correction to be continuing. If shares break 99.00 support level so the bearish reversal may be started, if not so the price will be on bullish ranging wityyhin Ichimoku cloud.
"NVIDIA Corp. after Thursday's close Feb 09, 2017's close. This leading stock was one of the strongest performing stocks in 2016. Nvidia hit a record high of $120.92/share in 2017 and is currently trading near $107/share. The stock is prone to big moves after reporting earnings and fell about $10 in the days after reporting earnings. Currently, it is testing its 50 day moving average lines which is a common area of support. The bulls want to see that level hold and for the stock to bounce higher from here."
------------------
"Jen-Hsun Huang, president and chief executive officer of Nvidia Corp., holds the Nvidia Spot as he speaks during a keynote presentation at the 2017 Consumer Electronics Show (CES) in Las Vegas, Nevada, U.S., on Wednesday, Jan. 4, 2017. Nvidia, the biggest maker of graphics chips, announced a new version of its Shield set-top box and the debut of an online service designed to bring millions of new consumers to high-end computer games."
HSBC: breakdown to bearish reversal Senkou Span level(based on the article)
Daily share price broke support levels to below: the price is testing 41.50/41.15 levels which are located near Senkou Span line to be reversed to the primary bearish market condition.
"Banking colossus HSBC was the FTSE 100’s leading faller in Tuesday business following the release of disappointing full-year financials. The stock was last dealing 7% lower from Monday’s close."
"Despite the shocking bottom-line fall, however, HSBC chief executive Stuart Gulliver described the results as ‘broadly satisfactory,’ the firm’s head citing the huge geopolitical and economic events last year which ‘temporarily influenced investment activity and contributed to volatile financial market conditions.’"
S&P 500 Technical Outlook: More of the Same for Now(based on the article)
Daily price is on bullish market condition to be above Ichimoku cloud: price broke 2351 resistance level to above for the bullish trend to be continuing.
"The S&P is currently between two trend-lines rising up from the low in November and one extending back to the Feb low last year. The latter is viewed as support on any minor dip from here, while the steeply rising November trend-line is viewed as potential resistance with further strength. We will continue to run with the trend, but are on alert for a sign of exhaustion and potential reversal."
"Tomorrow, at 19:00 GMT the FOMC minutes from the Jan 31/Feb 1 will be released – a potential source of volatility, but not expected to rock the boat too much. Outside of the minutes the calendar is lacking in terms of scheduled high impact events this week. See the economic calendar for events on the docket."
The relentless rise in the U.S. continued on Friday with new record closes in the major indices; the S&P 500 has tacked on about 13% since it bottomed ahead of the U.S. presidential election in November. As we said last week, the market appears to be in a . When and where it stops is difficult to predict, but risk is clearly rising for fresh...
Who Can Trade a Scalping Strategy?(based on dailyfx article)
Scalpers look to trade session momentum
Scalpers do not have to be high frequency traders
Anyone can scalp with an appropriate trading plan
The term scalping elicits different preconceived connotations to
different traders. Despite what you may already think, scalping can be a
viable short term trading methodology for anyone. So today we will look
at what exactly is scalping, and who can be successful with a scalping
based strategy.
What is a Scalper?
So you’re interested in scalping? A Forex scalper is considered anyone
that takes one or more positions throughout a trading day. Normally
these positions are based around short term market fluctuations as price
gathers momentum during a particular trading session. Scalpers look to
enter the market, and preferably exit positions prior to the market
close.
Normally scalpers employ technical trading strategies utilizing short
term support and resistance levels for entries. While normally
fundamentals don’t factor into a scalpers trading plan, it is important
to keep an eye on the economic calendar to see when news may increase
the market’s volatility.
High Frequency Trading
There is a strong misconception that all scalpers are high frequency
traders. So how many trades a day does it take to be considered a
scalper? Even though high frequency traders ARE scalpers, in order for
you to qualify as a scalper you only need to take 1 position a day! That
is one of the benefits of scalping. You can trade as much or as little
as you like within a giving trading period.
This also falls in line with one of the benefits of the Forex market.
Due to the 24Hr trading structure of Forex, you can scalp the market at
your convenience. Take advantage of the quiet Asia trading session, or
the volatile New York – London overlap. Trade as much or as little as
you like. As a scalper the choice is ultimately yours to make!
Risks
There are always risks associated with trading. Whether you are a short
term, long term, or any kind of trader in between any time you open a
position you should work on managing your risk. This is especially true
for scalpers. If the market moves against you suddenly due to news or
another factor, you need to have a plan of action for limiting your
losses.
There are other misconceptions that scalpers are very aggressive traders
prone to large losses. One way to help combat this is to make scalping a
mechanical process. This means that all of your decisions regarding
entries, exits, trade size, leverage and other factors should be written
down and finalized before approaching the charts. Most scalpers look to
risk 1% or even less of their account balance on any one position
taken!
Who can Scalp?
So this brings us to the final question. Who can be a scalper? The
answer is anyone with the dedication to develop a trading strategy and
the time to implement that strategy on any given trading day.
Crude Oil Price Forecast: ranging within narrow 57.42/53.56 levels(based on the article)
Daily price is located on the bullish area of the chart to be above 100-day SMA/200-day SMA reversal: the price is on ranging within narrow 57.42/53.56 support/resistance levels for the 57.42 level to be testing to above for the bullish trend to be continuing.
"Price consolidations that are visualized as a sideways move are very boring to watch, but their bias is rather clear. Consolidation tends to favor continuation of the prior trend. Since Mid-August, the price of Crude Oil has march confidently higher alongside many other commodities and commodity currencies. While Crude Oil has lagged many of its commodity brethren, there does appear to be a unified march higher in the commodity field that could continue if the anticipation of inflation persists."
"On the fundamental front, we got word that OPEC is looking to step up its compliance with the late-November supply cut accord. Recent numbers we’ve seen were regarding compliance to the agreed-upon cuts were as high as 92%, but recent comments from OPEC were revealed to seek 100% compliance, which would further drop the international supply of Oil, which could continue to favor further upside."
Weekly EUR/USD Outlook: 2017, February 19 - February 26 (based on the article)
EUR/USD was looking for a new direction as politics continued moving markets. The upcoming week features PMIs and some business surveys.
NZD/USD Intra-Day Fundamentals: New Zealand Producer Price Index and 38 pips range price movement
2017-02-19 21:45 GMT | [NZD - PPI Input]
if actual > forecast (or previous one) = good for currency (for NZD in our case)
[NZD - PPI Input] = Change in the price of goods and raw materials purchased by manufacturers.
==========
From official report:
==========
NZD/USD M5: 38 pips range price movement by New Zealand Producer Price Index news event
Daily price is located below 100 SMA/200 SMA in the bearish area of the chart for the ranging between Fibo support level at 1.0521 and Fibo resistance level at 1.0828.
If the price breaks 1.0521 support so the primary bearish trend will be resumed, if the price breaks 1.0828 resistance so the secondary rally will be started, otherwise - ranging.
USD/CAD Intra-Day Fundamentals: Canada's Wholesale Trade and range price movement
2017-02-20 13:30 GMT | [CAD - Wholesale Sales]
if actual > forecast (or previous one) = good for currency (for CAD in our case)
[CAD - Wholesale Sales] = Change in the total value of sales at the wholesale level.
==========
From official report:
==========
USD/CAD M5: range price movement by Canada's Wholesale Trade news event
AUD/USD Intra-Day Fundamentals: RBA Monetary Policy Meeting Minutes and 21 pips range price movement
2017-02-21 00:30 GMT | [AUD - Monetary Policy Meeting Minutes]
[AUD - Monetary Policy Meeting Minutes] = Detailed record of the RBA Reserve Bank Board's most recent meeting, providing in-depth insights into the economic conditions that influenced their decision on where to set interest rates.
==========
From macrobusiness article:
==========
AUD/USD M5: 21 pips range price movement by RBA Monetary Policy Meeting Minutes news event
Nvidia - one of the strongest performing stocks in 2016 (based on the article)
Shares price is located in the bullish area of the daily chart above Ichimoku cloud: the price is continuing with the secondary correction by breaking descending triangle pattern together with 105.65 support level to below for the correction to be continuing. If shares break 99.00 support level so the bearish reversal may be started, if not so the price will be on bullish ranging wityyhin Ichimoku cloud.
"NVIDIA Corp. after Thursday's close Feb 09, 2017's close. This leading stock was one of the strongest performing stocks in 2016. Nvidia hit a record high of $120.92/share in 2017 and is currently trading near $107/share. The stock is prone to big moves after reporting earnings and fell about $10 in the days after reporting earnings. Currently, it is testing its 50 day moving average lines which is a common area of support. The bulls want to see that level hold and for the stock to bounce higher from here."
------------------
"Jen-Hsun Huang, president and chief executive officer of Nvidia Corp., holds the Nvidia Spot as he speaks during a keynote presentation at the 2017 Consumer Electronics Show (CES) in Las Vegas, Nevada, U.S., on Wednesday, Jan. 4, 2017. Nvidia, the biggest maker of graphics chips, announced a new version of its Shield set-top box and the debut of an online service designed to bring millions of new consumers to high-end computer games."
HSBC: breakdown to bearish reversal Senkou Span level (based on the article)
Daily share price broke support levels to below: the price is testing 41.50/41.15 levels which are located near Senkou Span line to be reversed to the primary bearish market condition.
S&P 500 Technical Outlook: More of the Same for Now (based on the article)
Daily price is on bullish market condition to be above Ichimoku cloud: price broke 2351 resistance level to above for the bullish trend to be continuing.
Forum on trading, automated trading systems and testing trading strategies
Press review
Sergey Golubev, 2014.03.07 09:08
Who Can Trade a Scalping Strategy? (based on dailyfx article)
The term scalping elicits different preconceived connotations to different traders. Despite what you may already think, scalping can be a viable short term trading methodology for anyone. So today we will look at what exactly is scalping, and who can be successful with a scalping based strategy.
What is a Scalper?
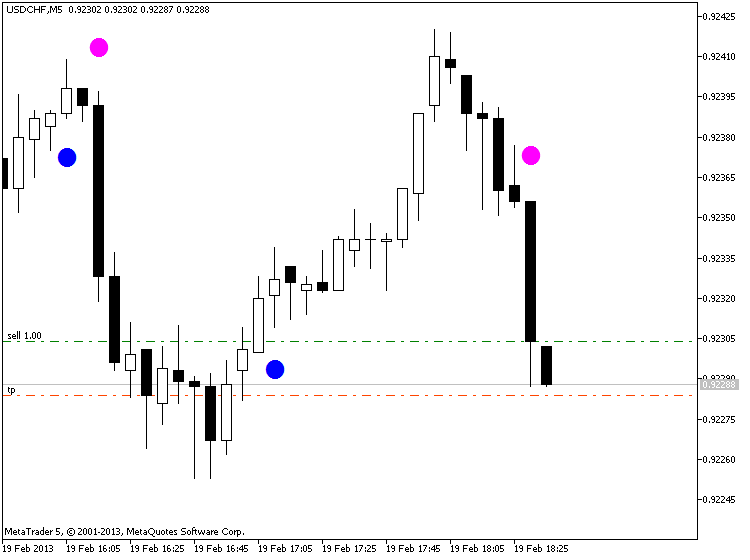
So you’re interested in scalping? A Forex scalper is considered anyone that takes one or more positions throughout a trading day. Normally these positions are based around short term market fluctuations as price gathers momentum during a particular trading session. Scalpers look to enter the market, and preferably exit positions prior to the market close.
Normally scalpers employ technical trading strategies utilizing short term support and resistance levels for entries. While normally fundamentals don’t factor into a scalpers trading plan, it is important to keep an eye on the economic calendar to see when news may increase the market’s volatility.
High Frequency Trading
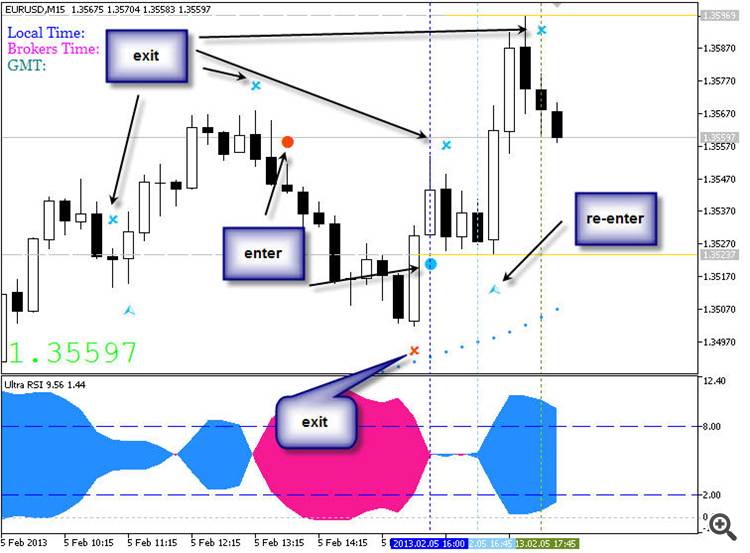
There is a strong misconception that all scalpers are high frequency traders. So how many trades a day does it take to be considered a scalper? Even though high frequency traders ARE scalpers, in order for you to qualify as a scalper you only need to take 1 position a day! That is one of the benefits of scalping. You can trade as much or as little as you like within a giving trading period.
This also falls in line with one of the benefits of the Forex market. Due to the 24Hr trading structure of Forex, you can scalp the market at your convenience. Take advantage of the quiet Asia trading session, or the volatile New York – London overlap. Trade as much or as little as you like. As a scalper the choice is ultimately yours to make!
Risks
There are always risks associated with trading. Whether you are a short term, long term, or any kind of trader in between any time you open a position you should work on managing your risk. This is especially true for scalpers. If the market moves against you suddenly due to news or another factor, you need to have a plan of action for limiting your losses.
There are other misconceptions that scalpers are very aggressive traders prone to large losses. One way to help combat this is to make scalping a mechanical process. This means that all of your decisions regarding entries, exits, trade size, leverage and other factors should be written down and finalized before approaching the charts. Most scalpers look to risk 1% or even less of their account balance on any one position taken!
Who can Scalp?
So this brings us to the final question. Who can be a scalper? The answer is anyone with the dedication to develop a trading strategy and the time to implement that strategy on any given trading day.
=================
Trading examples
Metaquotes demo
GoMarkets broker, initial deposit is 1,000
Alpari UK broker initial deposit is 1,000
RoboForex broker initial deposit is 1,000
Crude Oil Price Forecast: ranging within narrow 57.42/53.56 levels (based on the article)
Daily price is located on the bullish area of the chart to be above 100-day SMA/200-day SMA reversal: the price is on ranging within narrow 57.42/53.56 support/resistance levels for the 57.42 level to be testing to above for the bullish trend to be continuing.