Forecast for Q2'16 - levels for NZD/USD - page 2
You are missing trading opportunities:
- Free trading apps
- Over 8,000 signals for copying
- Economic news for exploring financial markets
Registration
Log in
You agree to website policy and terms of use
If you do not have an account, please register
Forum on trading, automated trading systems and testing trading strategies
Press review
Sergey Golubev, 2016.05.18 07:28
NZD/USD Intra-Day Fundamentals: NZ Producer Price Index Input and 10 pips price movement
2016-05-17 22:45 GMT | [NZD - PPI Input]
if actual > forecast (or previous one) = good for currency (for NZD in our case)
[NZD - PPI Input] = Change in the price of goods and raw materials purchased by manufacturers.
==========
==========
NZD/USD M5: 10 pips price movement by RBNZ Inflation Expectations news event :
Forum on trading, automated trading systems and testing trading strategies
Press review
Sergey Golubev, 2016.05.21 10:35
Fundamental Weekly Forecasts for Dollar Index, GBP/USD, USD/CNH, AUD/USD, USD/CAD, NZD/USD and GOLD (based on the article)
NZD/USD - "Like other economies tied to commodities and China, consistent economic new release surprises in New Zealand’s data alongside increasing doubts of any rate cuts from the RBNZ has led to an appreciation of the NZD. Understandably, a balance trade economy that is commodity-reliant favors a weaker US Dollar, but a stronger currency does make exports less attractive to other nations. Therefore, we’ll need to be on the lookout for Wheeler’s tone about this potential development to see if the price of NZD/USD goes outside of their tolerance level if we hold above the 200-DMA."Daily price is on primary bullish condition located above 100 SMA/200 SMA reversal area: the price is on ranging within 0.6846 resistance and 30-day low at 0.6709 with the symmetric triangle pattern to be formed for the direction of the trend to be established.
If the price breaks 0.6846 resistance level to above so the daily bullish trend will be continuing up to 30-day high at 0.7052 as the next bullish target.
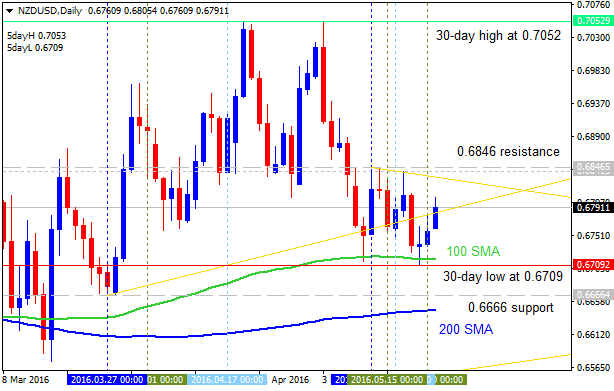
If the price breaks 30-day low at 0.6709 to below so the reversal of the price movement from the primary bullish to the daily bearish will be started.
if not so the price will be on bullish ranging within the levels.
Forum on trading, automated trading systems and testing trading strategies
Press review
Sergey Golubev, 2016.05.25 08:34
NZD/USD Intra-Day Fundamentals: NZ Trade Balance and 22 pips price movement
2016-05-24 22:45 GMT | [NZD - Trade Balance]
if actual > forecast (or previous one) = good for currency (for GBP in our case)
[NZD - Trade Balance] = Difference in value between imported and exported goods during the reported month.
==========
For April 2016 compared with April 2015:
==========
NZD/USD M5: 22 pips price movement by NZ Trade Balance news event
NZD/USD Technical Analysis 2016, 05.06 - 12.06: Fibo level at 0.6959 to be broken for the bullish breakout to be continuing
Daily price is located above 100 SMA/200 SMA reversal area for the primary bullish market condition. The price is on breakout for the testing 0.6959 resistance level for the bullish trend to be continuing with 0.7053 level as a nearest bullish target. Alternative, if the price breaks 0.6674 support level to below so the reversal of the price movement from the primary bullish to the primary bearish market condition will be started.
If D1 price will break 0.6674 support level on close bar so the reversal of the price movement from the primary bullish to the primary bearish market condition will be started.
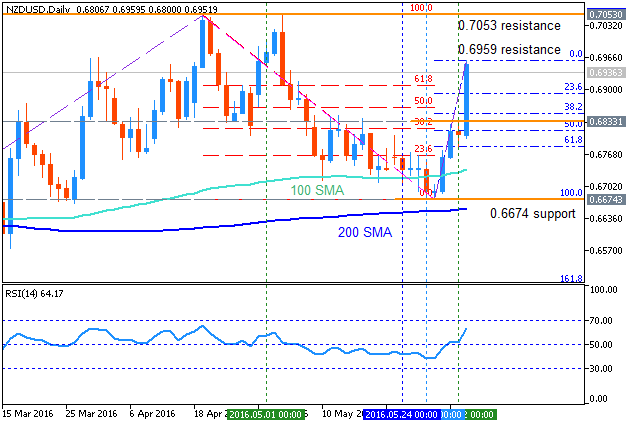
If D1 price will break 0.6959 resistance level on close bar so the bullish trend will be continuing.
If not so the price will be on ranging within the levels.
SUMMARY : breakout
TREND : bullishForum on trading, automated trading systems and testing trading strategies
Press review
Sergey Golubev, 2016.06.08 20:21
Trading News Events: Reserve Bank of New Zealand Official Cash Rate (adapted from the article)
M5 price is located above 100 period SMA and 200 period SMA for the bullish market condition: the price is on ranging within the following support/resistance levels:
If M5 price breaks 0.7000 support level to below on close bar so the reversal of the intra-day price movement from the primary bullish to the primary bearish market condition will be started.
If M5 price will break 0.7053 resistance level on close bar so the bullish trend will be continuing.
If not so the price will be on ranging within the levels.
Daily price is located above Ichimoku cloud and Senkou Span line which is the virtual border between the primary bearish and the primary bullish trend on Ichimoku chart. The price is breaking 0.6980 resistance level to above on daily open bar for 0.7053 level as the next bullish target to re-enter. Chinkou Span line is breaking the price to above for good possible breakout, and Absolute Strength indicator together with Trend Strength indicator are estimating the bullish trend to be continuing.
Forum on trading, automated trading systems and testing trading strategies
Press review
Sergey Golubev, 2016.06.09 06:17
NZD/USD M5: 110 pips range price movement by RBNZ Official Cash Rate news event
M5 price broke 0.7026/0.7053 resistance levels to above: the price is testing 0.7137 resistance for the intra-day bullish trend to be continuing.
Besides, daily bar was opened to be above 0.7053 level which is indicating the crossing it to above on close D1 bar for the daily bullish trend continuation.
Forum on trading, automated trading systems and testing trading strategies
Press review
Sergey Golubev, 2016.06.11 10:11
Fundamental Weekly Forecasts for Dollar Index, NZD/USD, GBP/USD, USD/CAD, USD/CNH, USD/JPY, AUD/USD and GOLD (based on the article)
NZD/USD - "Despite the macro-prudential measures designed to offset continued gains in New Zealand real estate, it’s becoming increasingly unlikely that we’ll see a near-term rate cut out of the RBNZ until the situation changes. The short-term issue is global inflation continuing to lag and that’s surely continuing to effect the lack of inflation in the New Zealand economy, but the systemic concerns around a housing bubble can have far more grave consequences; and given the RBNZ’s recent stance, it appears unlikely that they’ll further that long-term risk of a deepening a housing bubble by molding policy to shorter-term needs."NZD/USD Technical Analysis 2016, 12.06 - 19.06: key resistance at 0.7146 to be broken for the daily bullish to be continuing
Daily price is on primary bullish market condition located above Ichimoku cloud and Senkou Span line which is the virtual border between the primary bearish and the primary bullish trend on the chart. The price is testing 0.7146 resistance level for the bullish trend to be continuing.
If D1 price will break 0.7052 support level on close bar so the local downtrend as the secondary correction within the primary bullish trend will be started.
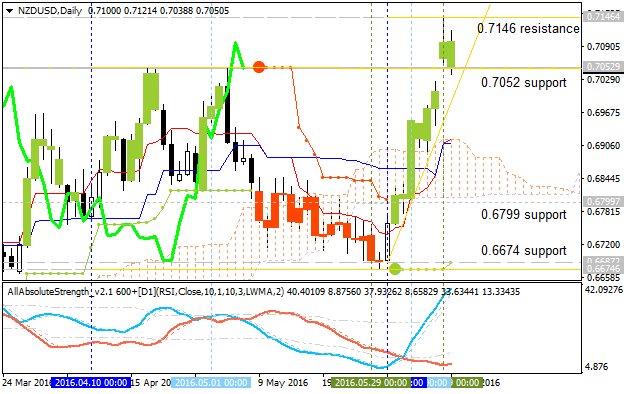
If D1 price will break 0.6799 support level to below on close bar so we may see the bearish reversal to be started.
If D1 price will break 0.7146 resistance level on close bar so the bullish trend will be continuing.
If not so the price will be on ranging within the levels.
NZDUSD Technical Analysis 2016, 19.06 - 26.06: bullish ranging with symmetric triangle pattern for the bullish continuation or the bearish reversal
Daily price is located above Ichimoku cliud for the bullish market condition. The price is on ranging within the following support/resistance levels:
Symmetric triangle pattern was formed by the price to be crossed for direction, and Absolute Strength indicator is estimating the trend as the ranging condition in the near future.
If D1 price will break 0.6891 support level on close bar so the reversal of the price movement from the primary bullish to the ranging bearish market condition will be started.
If D1 price will break 0.7146 resistance level on close bar from below to above so the bullish trend will be continuing.
If not so the price will be on ranging within the levels.
SUMMARY : bullish
TREND : rangingForum on trading, automated trading systems and testing trading strategies
Press review
Sergey Golubev, 2016.06.29 08:10
Technical Targets for NZD/USD by United Overseas Bank (based on the article)
NZD/USD: intra-day ranging bullish; daily correction to be started
H4 price is on bullish market condition for the ranging within 0.7289 resistance and 0.6970 support levels. The Brexit breakdown dropped the price to 0.6970 bearish reversal level with the price to be started for the ranging near 200 SMA revesal area.
If the price breaks 0.7289 level to above so the intra-day bullish trend will be continuing, and if the price breaks 0.6970 level to below so the bearish reversal will be started.
Daily price is on secondary correction within the primary bullish condition: the price is testing 0.6970 support level to below for the correction to be continuing.
United Overseas Bank is considering the NZD/USD price to be on ranging within 0.6975/0.7170 levels:
"The pull-back from last Friday’s 0.7305 high is picking up momentum but only a clear break below 0.6975 would indicate that NZD is ready to head lower towards 0.6920 and beyond. In the meanwhile, we hold a neutral view but unless this pair can reclaim 0.7170, the downside risk would continue to increase."