Join our fan page
- Views:
- 26394
- Rating:
- Published:
- Updated:
-
Need a robot or indicator based on this code? Order it on Freelance Go to Freelance
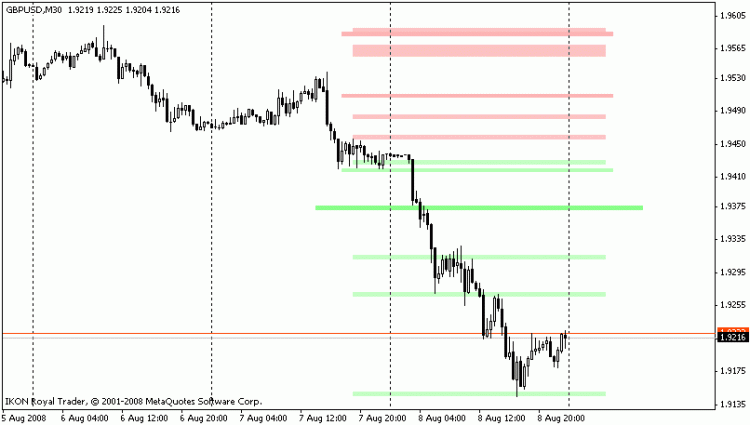
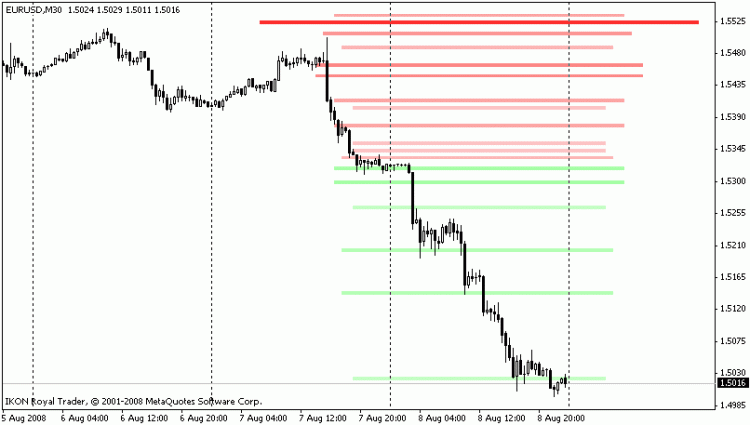
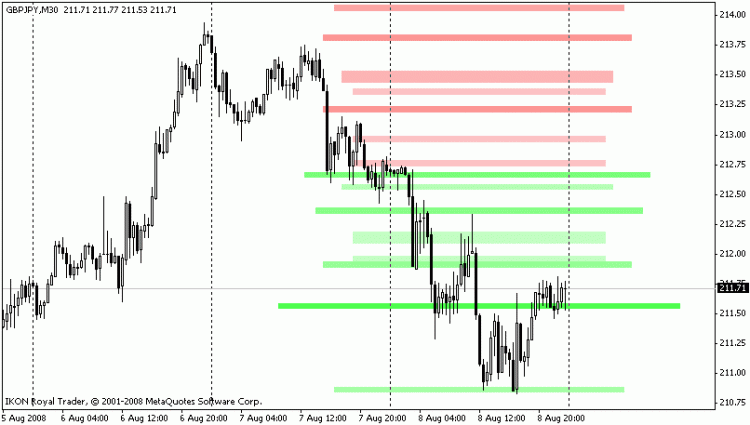
It Shows you more than 160 type of Support and Resistance levels.
It Class levels with Colors grade of Red and Green.
This Is my explain in arabic .
I was able to program this indicator, which displays more than 160 support level and resistance in a beautiful and focused manner without complicating or jamming.
I relied on the colors of red and green with their gradations from the white until the last degree of red or green.
The idea is simply depends on collecting these levels and transform it into varying degrees of color to show these levels after that in a really terrific and very useful.
I also relied on the level width the stronger it was the darker color it was and also its width is larger and this to facilitate the distinction between the strength of these levels.
The color increasing is not at equal rates, but according to the strength level as well.
The levels that took into consideration are: (with the possibility of increasing in the future as needed)
- Strong levels (Waddah Attar Strong Level) daily, weekly and monthly with its gradations and it equals 63 level.
- Hidden levels (Waddah Attar Hidden Level) daily, weekly and monthly level and it equals 21 level.
RSI Saturation daily levels (Waddah Attar RSI Level) and its number is 11.
Daily, weekly and monthly pivot levels with subsidies and resistance for each level and the final number is 33 level.
Daily, weekly and monthly camarilla levels with subsidies and resistance for each level and the final number is 24 level.
- Daily, weekly and monthly high and low levels with its averages and the total number is 9 level.
As we mentioned that new levels could be add to the final levels system as needed.
Showing or hiding each set of levels can be controlled by the characteristics of the index itself.
Also the thickness of the Step through which we want to collect all these levels with each other can be controlled.
And also the upper and lower field through which d we want to view these levels in it can be controlled.
Also the way of viewing these levels can controlled is it subsidies or resistances according to the current price or to the daily opening.
In other meaning, any level of support turns into resistance when it is broken, and vice versa. and its viewing method can be controlled by the feature AutoSupRes.
Finally, the percentage of viewing the strong combined levels can be controlled so that the weak levels disappear.
 MultiMA
Shows - in this version - up to 3 MA from different timeframes. Maybe is usefulll for someone. Enter the period for the ma's in Minute of the desired timeframe, f.e ma2_periode=15 shows you the ma for the timeframe M15. Enter in ma2 the Calculte Perio
 Xaos Patterns Explorer
Indicator Xaos Patterns Explorer.


