Ставь лайки и следи за новостями
Поставь на него ссылку - пусть другие тоже оценят
Оцени его работу в терминале MetaTrader 5
- Просмотров:
- 828
- Рейтинг:
- Опубликован:
-
Нужен робот или индикатор на основе этого кода? Закажите его на бирже фрилансеров Перейти на биржу
Для загрузки скомпилированной версии вы можете перейти по этой ссылке.
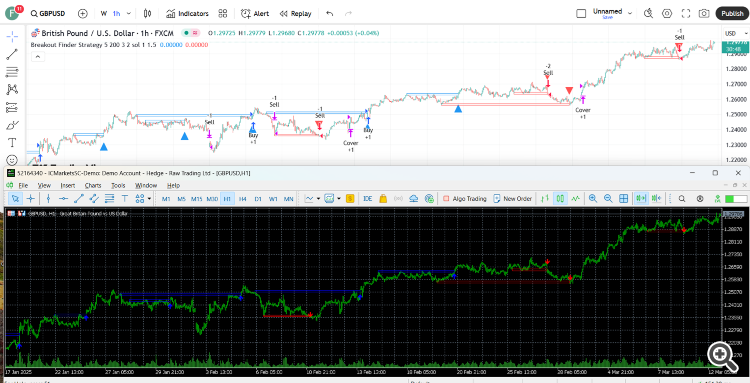
Он выполняет расчеты для всех баров с обратным взглядом каждый раз, когда закрывается новый бар. Чтобы этого не происходило, вам нужно иметь phval, phloc, plval и plloc в качестве буферов. Поскольку терминал не управляет сложными структурами как буферами, вам придется управлять буферами самостоятельно.
// Этот исходный код подчиняется условиям Общественной лицензии Mozilla 2.0 по адресу https://mozilla.org/MPL/2.0/.
// © LonesomeTheBlue

//@version=4
study("Breakout Finder", "BF", overlay = true, max_bars_back = 500, max_lines_count = 400)
prd = input(defval = 5, title="Period", minval = 2)
bo_len = input(defval = 200, title="Max Breakout Length", minval = 30, maxval = 300)
cwidthu = input(defval = 3., title = "Threshold Rate %", minval = 1., maxval = 10) / 100
mintest = input(defval = 2, title = "Minimum Number of Tests", minval = 1)
bocolorup = input(defval = color.blue, title = "Breakout Colors", inline = "bocol")
bocolordown = input(defval = color.red, title = "", inline = "bocol")
lstyle = input(defval = line.style_solid, title = "Line Style", options = [line.style_solid, line.style_dashed, line.style_dotted])

//width
lll = max(min(bar_index, 300), 1)
float h_ = highest(lll)
float l_ = lowest(lll)
float chwidth = (h_ - l_) * cwidthu

// проверка наличия PH/PL
ph = pivothigh(prd, prd)
pl = pivotlow(prd, prd)

// храните точки поворота и их местоположение в массивах
var phval = array.new_float(0)
var phloc = array.new_int(0)
var plval = array.new_float(0)
var plloc = array.new_int(0)

// сохранять уровни и местоположение PH/PL
if ph
    array.unshift(phval, ph)
    array.unshift(phloc, bar_index - prd)
    if array.size(phval) > 1 // очистите старые
        for x = array.size(phloc) - 1 to 1
            if bar_index - array.get(phloc, x) > bo_len
                array.pop(phloc)
                array.pop(phval)

if pl
    array.unshift(plval, pl)
    array.unshift(plloc, bar_index - prd)
    if array.size(plval) > 1 // очистите старые
        for x = array.size(plloc) - 1 to 1
            if bar_index - array.get(plloc, x) > bo_len
                array.pop(plloc)
                array.pop(plval)

// проверка бычьей чашки
float bomax = na
int bostart = bar_index
num = 0
hgst = highest(prd)[1]
if array.size(phval) >= mintest and close > open and close > hgst
    bomax := array.get(phval, 0)
    xx = 0
    for x = 0 to array.size(phval) - 1
        if array.get(phval, x) >= close
            break
        xx := x
        bomax := max(bomax, array.get(phval, x))
    if xx >= mintest and open <= bomax
        for x = 0 to xx
            if array.get(phval, x) <= bomax and array.get(phval, x) >= bomax - chwidth
                num += 1
                bostart := array.get(phloc, x)
        if num < mintest or hgst >= bomax
            bomax := na

if not na(bomax) and num >= mintest
    line.new(x1 = bar_index, y1 = bomax, x2 = bostart, y2 = bomax, color = bocolorup, style = lstyle)
    line.new(x1 = bar_index, y1 = bomax - chwidth, x2 = bostart, y2 = bomax - chwidth, color = bocolorup, style = lstyle)
    line.new(x1 = bostart, y1 = bomax - chwidth, x2 = bostart, y2 = bomax, color = bocolorup, style = lstyle)
    line.new(x1 = bar_index, y1 = bomax - chwidth, x2 = bar_index, y2 = bomax, color = bocolorup, style = lstyle)

plotshape(not na(bomax) and num >= mintest, location = location.belowbar, style  = shape.triangleup, color = bocolorup, size = size.small)
alertcondition(not na(bomax) and num >= mintest, title = "Breakout", message = "Breakout")

// проверка медвежьей чашки
float bomin = na
bostart := bar_index
num1 = 0
lwst = lowest(prd)[1]
if array.size(plval) >= mintest and close < open and close < lwst
    bomin := array.get(plval, 0)
    xx = 0
    for x = 0 to array.size(plval) - 1
        if array.get(plval, x) <= close
            break
        xx := x
        bomin := min(bomin, array.get(plval, x))
    if xx >= mintest and open >= bomin
        for x = 0 to xx
            if array.get(plval, x) >= bomin and array.get(plval, x) <= bomin + chwidth
                num1 += 1
                bostart := array.get(plloc, x)
        if num1 < mintest or lwst <= bomin
            bomin := na

if not na(bomin) and num1 >= mintest
    line.new(x1 = bar_index, y1 = bomin, x2 = bostart, y2 = bomin, color = bocolordown, style = lstyle)
    line.new(x1 = bar_index, y1 = bomin + chwidth, x2 = bostart, y2 = bomin + chwidth, color = bocolordown, style = lstyle)
    line.new(x1 = bostart, y1 = bomin + chwidth, x2 = bostart, y2 = bomin, color = bocolordown, style = lstyle)
    line.new(x1 = bar_index, y1 = bomin + chwidth, x2 = bar_index, y2 = bomin, color = bocolordown, style = lstyle)

plotshape(not na(bomin) and num1 >= mintest, location = location.abovebar, style  = shape.triangledown, color = bocolordown, size = size.small)

alertcondition(not na(bomin) and num1 >= mintest, title = "Breakdown", message = "Breakdown")
alertcondition((not na(bomax) and num >= mintest) or (not na(bomin) and num1 >= mintest), title = "Breakout or Breakdown", message = "Breakout or Breakdown")
Перевод с английского произведен MetaQuotes Ltd.
Оригинальная публикация: https://www.mql5.com/en/code/57597
 Withdrawal Tracking
Это часть кода, которую нужно добавить к существующему советнику, чтобы отслеживать снятие средств со счета, на котором работает советник. Это поможет пользователю отслеживать снятие средств с конкретного счета.
 Ranging Market Detector
Индикатор, который пытается выделить область рынка, находящуюся в диапазоне
 FVG based Momentum Detection
Это индикатор, который оценивает FVG в введенном "window_size" для определения импульса или силы тренда.
 Trend Zigzag (on ma cross)
Статический зигзаг, соединяющий точки пересечения скользящей средней
