Rejoignez notre page de fans
- Vues:
- 205
- Note:
- Publié:
-
Besoin d'un robot ou d'un indicateur basé sur ce code ? Commandez-le sur Freelance Aller sur Freelance
Pour télécharger la version compilée, vous pouvez suivre ce lien.
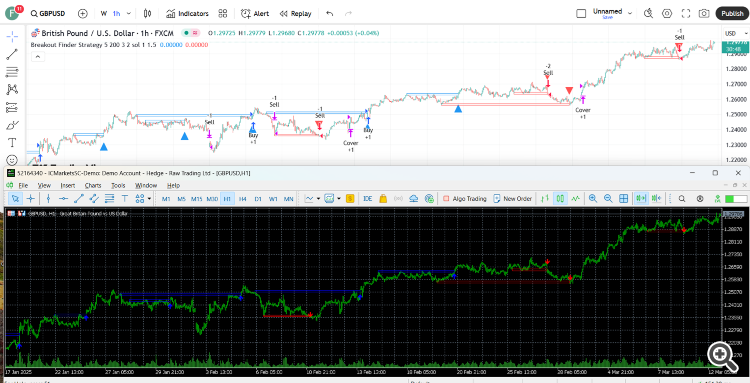
Ce programme effectue des calculs pour toutes les barres de référence à chaque fois qu'une nouvelle barre est fermée. Pour éviter cela, vous devez avoir phval, phloc, plval et plloc comme tampons. Comme le terminal ne gère pas les structures compliquées comme des tampons, vous devrez gérer vous-même les tampons.
// Ce code source est soumis aux termes de la Mozilla Public License 2.0 à l'adresse suivante : https://mozilla.org/MPL/2.0/
// © LonesomeTheBlue

//@version=4
study("Breakout Finder", "BF", overlay = true, max_bars_back = 500, max_lines_count = 400)
prd = input(defval = 5, title="Period", minval = 2)
bo_len = input(defval = 200, title="Max Breakout Length", minval = 30, maxval = 300)
cwidthu = input(defval = 3., title = "Threshold Rate %", minval = 1., maxval = 10) / 100
mintest = input(defval = 2, title = "Minimum Number of Tests", minval = 1)
bocolorup = input(defval = color.blue, title = "Breakout Colors", inline = "bocol")
bocolordown = input(defval = color.red, title = "", inline = "bocol")
lstyle = input(defval = line.style_solid, title = "Line Style", options = [line.style_solid, line.style_dashed, line.style_dotted])

//Largeur
lll = max(min(bar_index, 300), 1)
float h_ = highest(lll)
float l_ = lowest(lll)
float chwidth = (h_ - l_) * cwidthu

// vérifier si PH/PL
ph = pivothigh(prd, prd)
pl = pivotlow(prd, prd)

//conserver les points de pivot et leurs emplacements dans les tableaux
var phval = array.new_float(0)
var phloc = array.new_int(0)
var plval = array.new_float(0)
var plloc = array.new_int(0)

// maintenir les niveaux et les lieux de PH/PL
if ph
    array.unshift(phval, ph)
    array.unshift(phloc, bar_index - prd)
    if array.size(phval) > 1 // nettoyer les anciens
        for x = array.size(phloc) - 1 to 1
            if bar_index - array.get(phloc, x) > bo_len
                array.pop(phloc)
                array.pop(phval)

if pl
    array.unshift(plval, pl)
    array.unshift(plloc, bar_index - prd)
    if array.size(plval) > 1 // nettoyer les anciens
        for x = array.size(plloc) - 1 to 1
            if bar_index - array.get(plloc, x) > bo_len
                array.pop(plloc)
                array.pop(plval)

// vérifier la coupe haussière
float bomax = na
int bostart = bar_index
num = 0
hgst = highest(prd)[1]
if array.size(phval) >= mintest and close > open and close > hgst
    bomax := array.get(phval, 0)
    xx = 0
    for x = 0 to array.size(phval) - 1
        if array.get(phval, x) >= close
            break
        xx := x
        bomax := max(bomax, array.get(phval, x))
    if xx >= mintest and open <= bomax
        for x = 0 to xx
            if array.get(phval, x) <= bomax and array.get(phval, x) >= bomax - chwidth
                num += 1
                bostart := array.get(phloc, x)
        if num < mintest or hgst >= bomax
            bomax := na

if not na(bomax) and num >= mintest
    line.new(x1 = bar_index, y1 = bomax, x2 = bostart, y2 = bomax, color = bocolorup, style = lstyle)
    line.new(x1 = bar_index, y1 = bomax - chwidth, x2 = bostart, y2 = bomax - chwidth, color = bocolorup, style = lstyle)
    line.new(x1 = bostart, y1 = bomax - chwidth, x2 = bostart, y2 = bomax, color = bocolorup, style = lstyle)
    line.new(x1 = bar_index, y1 = bomax - chwidth, x2 = bar_index, y2 = bomax, color = bocolorup, style = lstyle)

plotshape(not na(bomax) and num >= mintest, location = location.belowbar, style  = shape.triangleup, color = bocolorup, size = size.small)
alertcondition(not na(bomax) and num >= mintest, title = "Breakout", message = "Breakout")

// vérifier la coupe baissière
float bomin = na
bostart := bar_index
num1 = 0
lwst = lowest(prd)[1]
if array.size(plval) >= mintest and close < open and close < lwst
    bomin := array.get(plval, 0)
    xx = 0
    for x = 0 to array.size(plval) - 1
        if array.get(plval, x) <= close
            break
        xx := x
        bomin := min(bomin, array.get(plval, x))
    if xx >= mintest and open >= bomin
        for x = 0 to xx
            if array.get(plval, x) >= bomin and array.get(plval, x) <= bomin + chwidth
                num1 += 1
                bostart := array.get(plloc, x)
        if num1 < mintest or lwst <= bomin
            bomin := na

if not na(bomin) and num1 >= mintest
    line.new(x1 = bar_index, y1 = bomin, x2 = bostart, y2 = bomin, color = bocolordown, style = lstyle)
    line.new(x1 = bar_index, y1 = bomin + chwidth, x2 = bostart, y2 = bomin + chwidth, color = bocolordown, style = lstyle)
    line.new(x1 = bostart, y1 = bomin + chwidth, x2 = bostart, y2 = bomin, color = bocolordown, style = lstyle)
    line.new(x1 = bar_index, y1 = bomin + chwidth, x2 = bar_index, y2 = bomin, color = bocolordown, style = lstyle)

plotshape(not na(bomin) and num1 >= mintest, location = location.abovebar, style  = shape.triangledown, color = bocolordown, size = size.small)

alertcondition(not na(bomin) and num1 >= mintest, title = "Breakdown", message = "Breakdown")
alertcondition((not na(bomax) and num >= mintest) or (not na(bomin) and num1 >= mintest), title = "Breakout or Breakdown", message = "Breakout or Breakdown")
Traduit de l’anglais par MetaQuotes Ltd.
Code original : https://www.mql5.com/en/code/57597
 Withdrawal Tracking
Il s'agit d'un morceau de code à ajouter à un Expert advisor existant pour suivre les retraits de votre compte sur lequel l'EA est exécuté. Il aide l'utilisateur à surveiller ses retraits d'un compte particulier.
 DemoBufferPattern
Démonstration d'un motif de tampon : Bougies + Fractales + ZigzagColor + ColorMaLine.
 Up and Down Indicator
Cet indicateur permet de voir l'activité du marché.
 Parabolique coloré
Ajout de couleurs à la parabole.
