Fan sayfamıza katılın
Öyleyse bir link gönderin -
başkalarının da faydalanmasını sağlayın
- Görüntülemeler:
- 180
- Derecelendirme:
- Yayınlandı:
-
Bu koda dayalı bir robota veya göstergeye mi ihtiyacınız var? Freelance üzerinden sipariş edin Freelance'e git
Derlenmiş sürümü indirmek için bu bağlantıyı takip edebilirsiniz.
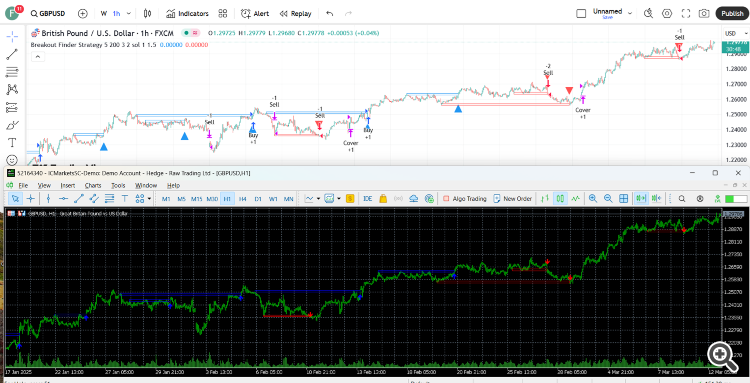
Bu, her yeni çubuk kapatıldığında tüm geri arama çubukları için hesaplamalar yapıyor. Bunu yapmamak için tampon olarak phval, phloc, plval ve plloc 'a sahip olmanız gerekecektir. Terminal karmaşık yapıları tampon olarak yönetmezken, tampon yönetimini kendiniz yapmak zorunda kalacaksınız.
// Bu kaynak kodu https://mozilla.org/MPL/2.0/ adresindeki Mozilla Kamu Lisansı 2.0 koşullarına tabidir.
// © LonesomeTheBlue

//@version=4
study("Breakout Finder", "BF", overlay = true, max_bars_back = 500, max_lines_count = 400)
prd = input(defval = 5, title="Period", minval = 2)
bo_len = input(defval = 200, title="Max Breakout Length", minval = 30, maxval = 300)
cwidthu = input(defval = 3., title = "Threshold Rate %", minval = 1., maxval = 10) / 100
mintest = input(defval = 2, title = "Minimum Number of Tests", minval = 1)
bocolorup = input(defval = color.blue, title = "Breakout Colors", inline = "bocol")
bocolordown = input(defval = color.red, title = "", inline = "bocol")
lstyle = input(defval = line.style_solid, title = "Line Style", options = [line.style_solid, line.style_dashed, line.style_dotted])

//genişlik
lll = max(min(bar_index, 300), 1)
float h_ = highest(lll)
float l_ = lowest(lll)
float chwidth = (h_ - l_) * cwidthu

// PH/PL olup olmadığını kontrol edin
ph = pivothigh(prd, prd)
pl = pivotlow(prd, prd)

//pivot noktalarını ve konumlarını dizilerde tutun
var phval = array.new_float(0)
var phloc = array.new_int(0)
var plval = array.new_float(0)
var plloc = array.new_int(0)

// PH/PL seviyelerini ve konumlarını koruyun
if ph
    array.unshift(phval, ph)
    array.unshift(phloc, bar_index - prd)
    if array.size(phval) > 1 // eskileri temizleyin
        for x = array.size(phloc) - 1 to 1
            if bar_index - array.get(phloc, x) > bo_len
                array.pop(phloc)
                array.pop(phval)

if pl
    array.unshift(plval, pl)
    array.unshift(plloc, bar_index - prd)
    if array.size(plval) > 1 // eskileri temizleyin
        for x = array.size(plloc) - 1 to 1
            if bar_index - array.get(plloc, x) > bo_len
                array.pop(plloc)
                array.pop(plval)

// yükseliş kupasını kontrol edin
float bomax = na
int bostart = bar_index
num = 0
hgst = highest(prd)[1]
if array.size(phval) >= mintest and close > open and close > hgst
    bomax := array.get(phval, 0)
    xx = 0
    for x = 0 to array.size(phval) - 1
        if array.get(phval, x) >= close
            break
        xx := x
        bomax := max(bomax, array.get(phval, x))
    if xx >= mintest and open <= bomax
        for x = 0 to xx
            if array.get(phval, x) <= bomax and array.get(phval, x) >= bomax - chwidth
                num += 1
                bostart := array.get(phloc, x)
        if num < mintest or hgst >= bomax
            bomax := na

if not na(bomax) and num >= mintest
    line.new(x1 = bar_index, y1 = bomax, x2 = bostart, y2 = bomax, color = bocolorup, style = lstyle)
    line.new(x1 = bar_index, y1 = bomax - chwidth, x2 = bostart, y2 = bomax - chwidth, color = bocolorup, style = lstyle)
    line.new(x1 = bostart, y1 = bomax - chwidth, x2 = bostart, y2 = bomax, color = bocolorup, style = lstyle)
    line.new(x1 = bar_index, y1 = bomax - chwidth, x2 = bar_index, y2 = bomax, color = bocolorup, style = lstyle)

plotshape(not na(bomax) and num >= mintest, location = location.belowbar, style  = shape.triangleup, color = bocolorup, size = size.small)
alertcondition(not na(bomax) and num >= mintest, title = "Breakout", message = "Breakout")

// düşüş kupasını kontrol edin
float bomin = na
bostart := bar_index
num1 = 0
lwst = lowest(prd)[1]
if array.size(plval) >= mintest and close < open and close < lwst
    bomin := array.get(plval, 0)
    xx = 0
    for x = 0 to array.size(plval) - 1
        if array.get(plval, x) <= close
            break
        xx := x
        bomin := min(bomin, array.get(plval, x))
    if xx >= mintest and open >= bomin
        for x = 0 to xx
            if array.get(plval, x) >= bomin and array.get(plval, x) <= bomin + chwidth
                num1 += 1
                bostart := array.get(plloc, x)
        if num1 < mintest or lwst <= bomin
            bomin := na

if not na(bomin) and num1 >= mintest
    line.new(x1 = bar_index, y1 = bomin, x2 = bostart, y2 = bomin, color = bocolordown, style = lstyle)
    line.new(x1 = bar_index, y1 = bomin + chwidth, x2 = bostart, y2 = bomin + chwidth, color = bocolordown, style = lstyle)
    line.new(x1 = bostart, y1 = bomin + chwidth, x2 = bostart, y2 = bomin, color = bocolordown, style = lstyle)
    line.new(x1 = bar_index, y1 = bomin + chwidth, x2 = bar_index, y2 = bomin, color = bocolordown, style = lstyle)

plotshape(not na(bomin) and num1 >= mintest, location = location.abovebar, style  = shape.triangledown, color = bocolordown, size = size.small)

alertcondition(not na(bomin) and num1 >= mintest, title = "Breakdown", message = "Breakdown")
alertcondition((not na(bomax) and num >= mintest) or (not na(bomin) and num1 >= mintest), title = "Breakout or Breakdown", message = "Breakout or Breakdown")
MetaQuotes Ltd tarafından İngilizceden çevrilmiştir.
Orijinal kod: https://www.mql5.com/en/code/57597
 Withdrawal Tracking
Bu, EA'nın çalıştığı hesabınızdan para çekme işlemlerini izlemek için mevcut bir Uzman danışmana eklenecek bir kod parçasıdır. Kullanıcının belirli bir hesaptan para çekme işlemlerini izlemesine yardımcı olur.
 DemoBufferPattern
Tampon desenini göstermek için: Mumlar + Fraktallar + ZigzagColor + ColorMaLine.
 Up and Down Indicator
Bu gösterge piyasanın aktivitesini görmeyi sağlar.
 Renkli parabolik
Parabolik'e renkler eklendi.
