Unisciti alla nostra fan page
- Visualizzazioni:
- 179
- Valutazioni:
- Pubblicato:
-
Hai bisogno di un robot o indicatore basato su questo codice? Ordinalo su Freelance Vai a Freelance
Per scaricare la versione compilata è possibile seguire questo link.
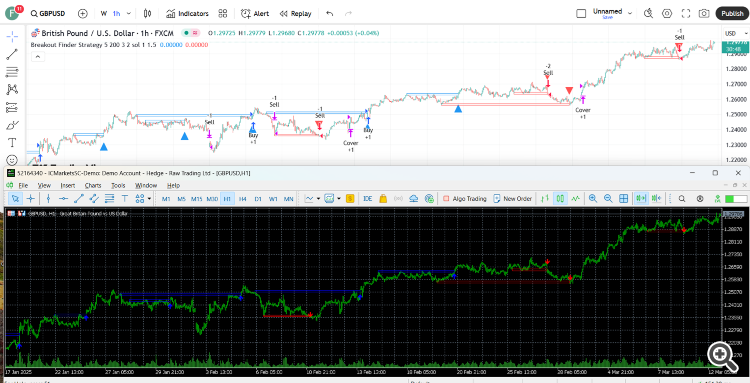
Il programma esegue i calcoli per tutte le barre di lookback ogni volta che viene chiusa una nuova barra. Per non farlo è necessario avere phval, phloc, plval e plloc come buffer. Sebbene il terminale non gestisca strutture complicate come buffer, dovrete gestire i buffer da soli.
// Questo codice sorgente è soggetto ai termini della Mozilla Public License 2.0 all'indirizzo https://mozilla.org/MPL/2.0/.
// © LonesomeTheBlue

//@versione=4
study("Breakout Finder", "BF", overlay = true, max_bars_back = 500, max_lines_count = 400)
prd = input(defval = 5, title="Period", minval = 2)
bo_len = input(defval = 200, title="Max Breakout Length", minval = 30, maxval = 300)
cwidthu = input(defval = 3., title = "Threshold Rate %", minval = 1., maxval = 10) / 100
mintest = input(defval = 2, title = "Minimum Number of Tests", minval = 1)
bocolorup = input(defval = color.blue, title = "Breakout Colors", inline = "bocol")
bocolordown = input(defval = color.red, title = "", inline = "bocol")
lstyle = input(defval = line.style_solid, title = "Line Style", options = [line.style_solid, line.style_dashed, line.style_dotted])

//larghezza
lll = max(min(bar_index, 300), 1)
float h_ = highest(lll)
float l_ = lowest(lll)
float chwidth = (h_ - l_) * cwidthu

// controllare se PH/PL
ph = pivothigh(prd, prd)
pl = pivotlow(prd, prd)

//conservare i punti cardine e le loro posizioni negli array
var phval = array.new_float(0)
var phloc = array.new_int(0)
var plval = array.new_float(0)
var plloc = array.new_int(0)

// mantenere i livelli e le posizioni di PH/PL
if ph
    array.unshift(phval, ph)
    array.unshift(phloc, bar_index - prd)
    if array.size(phval) > 1 // ripulire quelli vecchi
        for x = array.size(phloc) - 1 to 1
            if bar_index - array.get(phloc, x) > bo_len
                array.pop(phloc)
                array.pop(phval)

if pl
    array.unshift(plval, pl)
    array.unshift(plloc, bar_index - prd)
    if array.size(plval) > 1 // ripulire quelli vecchi
        for x = array.size(plloc) - 1 to 1
            if bar_index - array.get(plloc, x) > bo_len
                array.pop(plloc)
                array.pop(plval)

// controllare la coppa rialzista
float bomax = na
int bostart = bar_index
num = 0
hgst = highest(prd)[1]
if array.size(phval) >= mintest and close > open and close > hgst
    bomax := array.get(phval, 0)
    xx = 0
    for x = 0 to array.size(phval) - 1
        if array.get(phval, x) >= close
            break
        xx := x
        bomax := max(bomax, array.get(phval, x))
    if xx >= mintest and open <= bomax
        for x = 0 to xx
            if array.get(phval, x) <= bomax and array.get(phval, x) >= bomax - chwidth
                num += 1
                bostart := array.get(phloc, x)
        if num < mintest or hgst >= bomax
            bomax := na

if not na(bomax) and num >= mintest
    line.new(x1 = bar_index, y1 = bomax, x2 = bostart, y2 = bomax, color = bocolorup, style = lstyle)
    line.new(x1 = bar_index, y1 = bomax - chwidth, x2 = bostart, y2 = bomax - chwidth, color = bocolorup, style = lstyle)
    line.new(x1 = bostart, y1 = bomax - chwidth, x2 = bostart, y2 = bomax, color = bocolorup, style = lstyle)
    line.new(x1 = bar_index, y1 = bomax - chwidth, x2 = bar_index, y2 = bomax, color = bocolorup, style = lstyle)

plotshape(not na(bomax) and num >= mintest, location = location.belowbar, style  = shape.triangleup, color = bocolorup, size = size.small)
alertcondition(not na(bomax) and num >= mintest, title = "Breakout", message = "Breakout")

// controllare la coppa ribassista
float bomin = na
bostart := bar_index
num1 = 0
lwst = lowest(prd)[1]
if array.size(plval) >= mintest and close < open and close < lwst
    bomin := array.get(plval, 0)
    xx = 0
    for x = 0 to array.size(plval) - 1
        if array.get(plval, x) <= close
            break
        xx := x
        bomin := min(bomin, array.get(plval, x))
    if xx >= mintest and open >= bomin
        for x = 0 to xx
            if array.get(plval, x) >= bomin and array.get(plval, x) <= bomin + chwidth
                num1 += 1
                bostart := array.get(plloc, x)
        if num1 < mintest or lwst <= bomin
            bomin := na

if not na(bomin) and num1 >= mintest
    line.new(x1 = bar_index, y1 = bomin, x2 = bostart, y2 = bomin, color = bocolordown, style = lstyle)
    line.new(x1 = bar_index, y1 = bomin + chwidth, x2 = bostart, y2 = bomin + chwidth, color = bocolordown, style = lstyle)
    line.new(x1 = bostart, y1 = bomin + chwidth, x2 = bostart, y2 = bomin, color = bocolordown, style = lstyle)
    line.new(x1 = bar_index, y1 = bomin + chwidth, x2 = bar_index, y2 = bomin, color = bocolordown, style = lstyle)

plotshape(not na(bomin) and num1 >= mintest, location = location.abovebar, style  = shape.triangledown, color = bocolordown, size = size.small)

alertcondition(not na(bomin) and num1 >= mintest, title = "Breakdown", message = "Breakdown")
alertcondition((not na(bomax) and num >= mintest) or (not na(bomin) and num1 >= mintest), title = "Breakout or Breakdown", message = "Breakout or Breakdown")
Tradotto dall’inglese da MetaQuotes Ltd.
Codice originale https://www.mql5.com/en/code/57597
 Withdrawal Tracking
Si tratta di un pezzo di codice da aggiungere a un Expert advisor esistente per monitorare i prelievi dal conto in cui l'EA è in esecuzione. Aiuta l'utente a monitorare i propri prelievi da un determinato conto.
 DemoBufferPattern
Per dimostrare il modello di buffer: Candele + Frattali + ZigzagColor + ColorMaLine.
 Up and Down Indicator
Questo indicatore permette di vedere l'attività del mercato.
 Parabola colorata
Aggiunta di colori alla parabolica.
