und werden Sie Mitglied unserer Fangruppe
Veröffentliche einen Link auf das Skript, damit die anderen ihn auch nutzen können
Bewerten Sie es im Terminal MetaTrader 5
- Ansichten:
- 258
- Rating:
- Veröffentlicht:
-
Benötigen Sie einen Roboter oder Indikator, der auf diesem Code basiert? Bestellen Sie ihn im Freelance-Bereich Zum Freelance
Um die kompilierte Version herunterzuladen, können Sie diesem Link folgen.
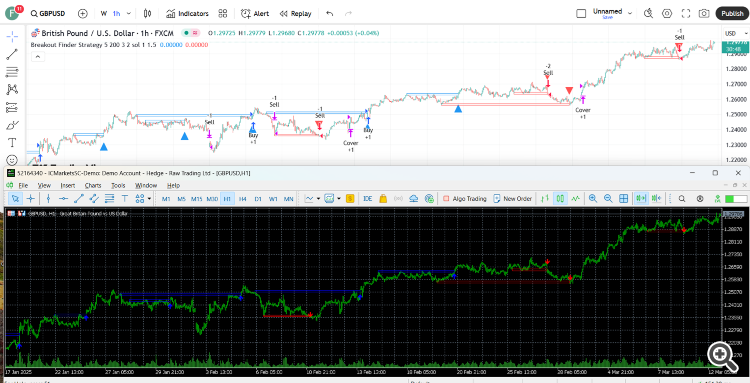
Dies führt Berechnungen für alle Lookback-Balken jedes Mal durch, wenn ein neuer Balken geschlossen wird. Um dies zu vermeiden, müssen Sie phval, phloc, plval und plloc als Puffer haben. Da das Terminal keine komplizierten Strukturen als Puffer verwaltet, müssen Sie die Pufferverwaltung selbst übernehmen.
// Dieser Quellcode unterliegt den Bedingungen der Mozilla Public License 2.0 unter https://mozilla.org/MPL/2.0/
// © LonesomeTheBlue

//@version=4
study("Breakout Finder", "BF", overlay = true, max_bars_back = 500, max_lines_count = 400)
prd = input(defval = 5, title="Period", minval = 2)
bo_len = input(defval = 200, title="Max Breakout Length", minval = 30, maxval = 300)
cwidthu = input(defval = 3., title = "Threshold Rate %", minval = 1., maxval = 10) / 100
mintest = input(defval = 2, title = "Minimum Number of Tests", minval = 1)
bocolorup = input(defval = color.blue, title = "Breakout Colors", inline = "bocol")
bocolordown = input(defval = color.red, title = "", inline = "bocol")
lstyle = input(defval = line.style_solid, title = "Line Style", options = [line.style_solid, line.style_dashed, line.style_dotted])

//breite
lll = max(min(bar_index, 300), 1)
float h_ = highest(lll)
float l_ = lowest(lll)
float chwidth = (h_ - l_) * cwidthu

// prüfen, ob PH/PL
ph = pivothigh(prd, prd)
pl = pivotlow(prd, prd)

//Punkte und ihre Positionen in den Feldern beibehalten
var phval = array.new_float(0)
var phloc = array.new_int(0)
var plval = array.new_float(0)
var plloc = array.new_int(0)

// PH/PL-Werte und -Standorte beibehalten
if ph
    array.unshift(phval, ph)
    array.unshift(phloc, bar_index - prd)
    if array.size(phval) > 1 // alte bereinigen
        for x = array.size(phloc) - 1 to 1
            if bar_index - array.get(phloc, x) > bo_len
                array.pop(phloc)
                array.pop(phval)

if pl
    array.unshift(plval, pl)
    array.unshift(plloc, bar_index - prd)
    if array.size(plval) > 1 // alte bereinigen
        for x = array.size(plloc) - 1 to 1
            if bar_index - array.get(plloc, x) > bo_len
                array.pop(plloc)
                array.pop(plval)

// bullische Tasse prüfen
float bomax = na
int bostart = bar_index
num = 0
hgst = highest(prd)[1]
if array.size(phval) >= mintest and close > open and close > hgst
    bomax := array.get(phval, 0)
    xx = 0
    for x = 0 to array.size(phval) - 1
        if array.get(phval, x) >= close
            break
        xx := x
        bomax := max(bomax, array.get(phval, x))
    if xx >= mintest and open <= bomax
        for x = 0 to xx
            if array.get(phval, x) <= bomax and array.get(phval, x) >= bomax - chwidth
                num += 1
                bostart := array.get(phloc, x)
        if num < mintest or hgst >= bomax
            bomax := na

if not na(bomax) and num >= mintest
    line.new(x1 = bar_index, y1 = bomax, x2 = bostart, y2 = bomax, color = bocolorup, style = lstyle)
    line.new(x1 = bar_index, y1 = bomax - chwidth, x2 = bostart, y2 = bomax - chwidth, color = bocolorup, style = lstyle)
    line.new(x1 = bostart, y1 = bomax - chwidth, x2 = bostart, y2 = bomax, color = bocolorup, style = lstyle)
    line.new(x1 = bar_index, y1 = bomax - chwidth, x2 = bar_index, y2 = bomax, color = bocolorup, style = lstyle)

plotshape(not na(bomax) and num >= mintest, location = location.belowbar, style  = shape.triangleup, color = bocolorup, size = size.small)
alertcondition(not na(bomax) and num >= mintest, title = "Breakout", message = "Breakout")

// check bearish cup
float bomin = na
bostart := bar_index
num1 = 0
lwst = lowest(prd)[1]
if array.size(plval) >= mintest and close < open and close < lwst
    bomin := array.get(plval, 0)
    xx = 0
    for x = 0 to array.size(plval) - 1
        if array.get(plval, x) <= close
            break
        xx := x
        bomin := min(bomin, array.get(plval, x))
    if xx >= mintest and open >= bomin
        for x = 0 to xx
            if array.get(plval, x) >= bomin and array.get(plval, x) <= bomin + chwidth
                num1 += 1
                bostart := array.get(plloc, x)
        if num1 < mintest or lwst <= bomin
            bomin := na

if not na(bomin) and num1 >= mintest
    line.new(x1 = bar_index, y1 = bomin, x2 = bostart, y2 = bomin, color = bocolordown, style = lstyle)
    line.new(x1 = bar_index, y1 = bomin + chwidth, x2 = bostart, y2 = bomin + chwidth, color = bocolordown, style = lstyle)
    line.new(x1 = bostart, y1 = bomin + chwidth, x2 = bostart, y2 = bomin, color = bocolordown, style = lstyle)
    line.new(x1 = bar_index, y1 = bomin + chwidth, x2 = bar_index, y2 = bomin, color = bocolordown, style = lstyle)

plotshape(not na(bomin) and num1 >= mintest, location = location.abovebar, style  = shape.triangledown, color = bocolordown, size = size.small)

alertcondition(not na(bomin) and num1 >= mintest, title = "Breakdown", message = "Breakdown")
alertcondition((not na(bomax) and num >= mintest) or (not na(bomin) and num1 >= mintest), title = "Breakout or Breakdown", message = "Breakout or Breakdown")
Übersetzt aus dem Englischen von MetaQuotes Ltd.
Originalpublikation: https://www.mql5.com/en/code/57597
 Withdrawal Tracking
Dies ist ein Code, der zu einem bestehenden Expert Advisor hinzugefügt werden kann, um Abhebungen von Ihrem Konto, auf dem der EA läuft, zu verfolgen. Es hilft dem Benutzer, seine Abhebungen von einem bestimmten Konto zu überwachen.
 Ranging Market Detector
Ein Indikator, der versucht, einen sich verändernden Marktbereich hervorzuheben
 Populationsbasierte Optimierungsalgorithmen
Hier werden populationsbasierte Optimierungsalgorithmen gesammelt. Das Archiv enthält alle notwendigen Dateien, um die Algorithmen auf Testfunktionen anzuwenden.
 FVG based Momentum Detection
Dies ist ein Indikator, der FVGs in der eingegebenen "window_size" auswertet, um Momentum oder Trendstärke zu erkennen.
